Slide 01 — Title
A Monte Carlo simulation study of HIV prevention for people who inject drugs. Under peer review at BMC Public Health. Preprint DOI: 10.20944/preprints202601.0948.v1
Slide 02 — The Efficacy-Effectiveness Gap
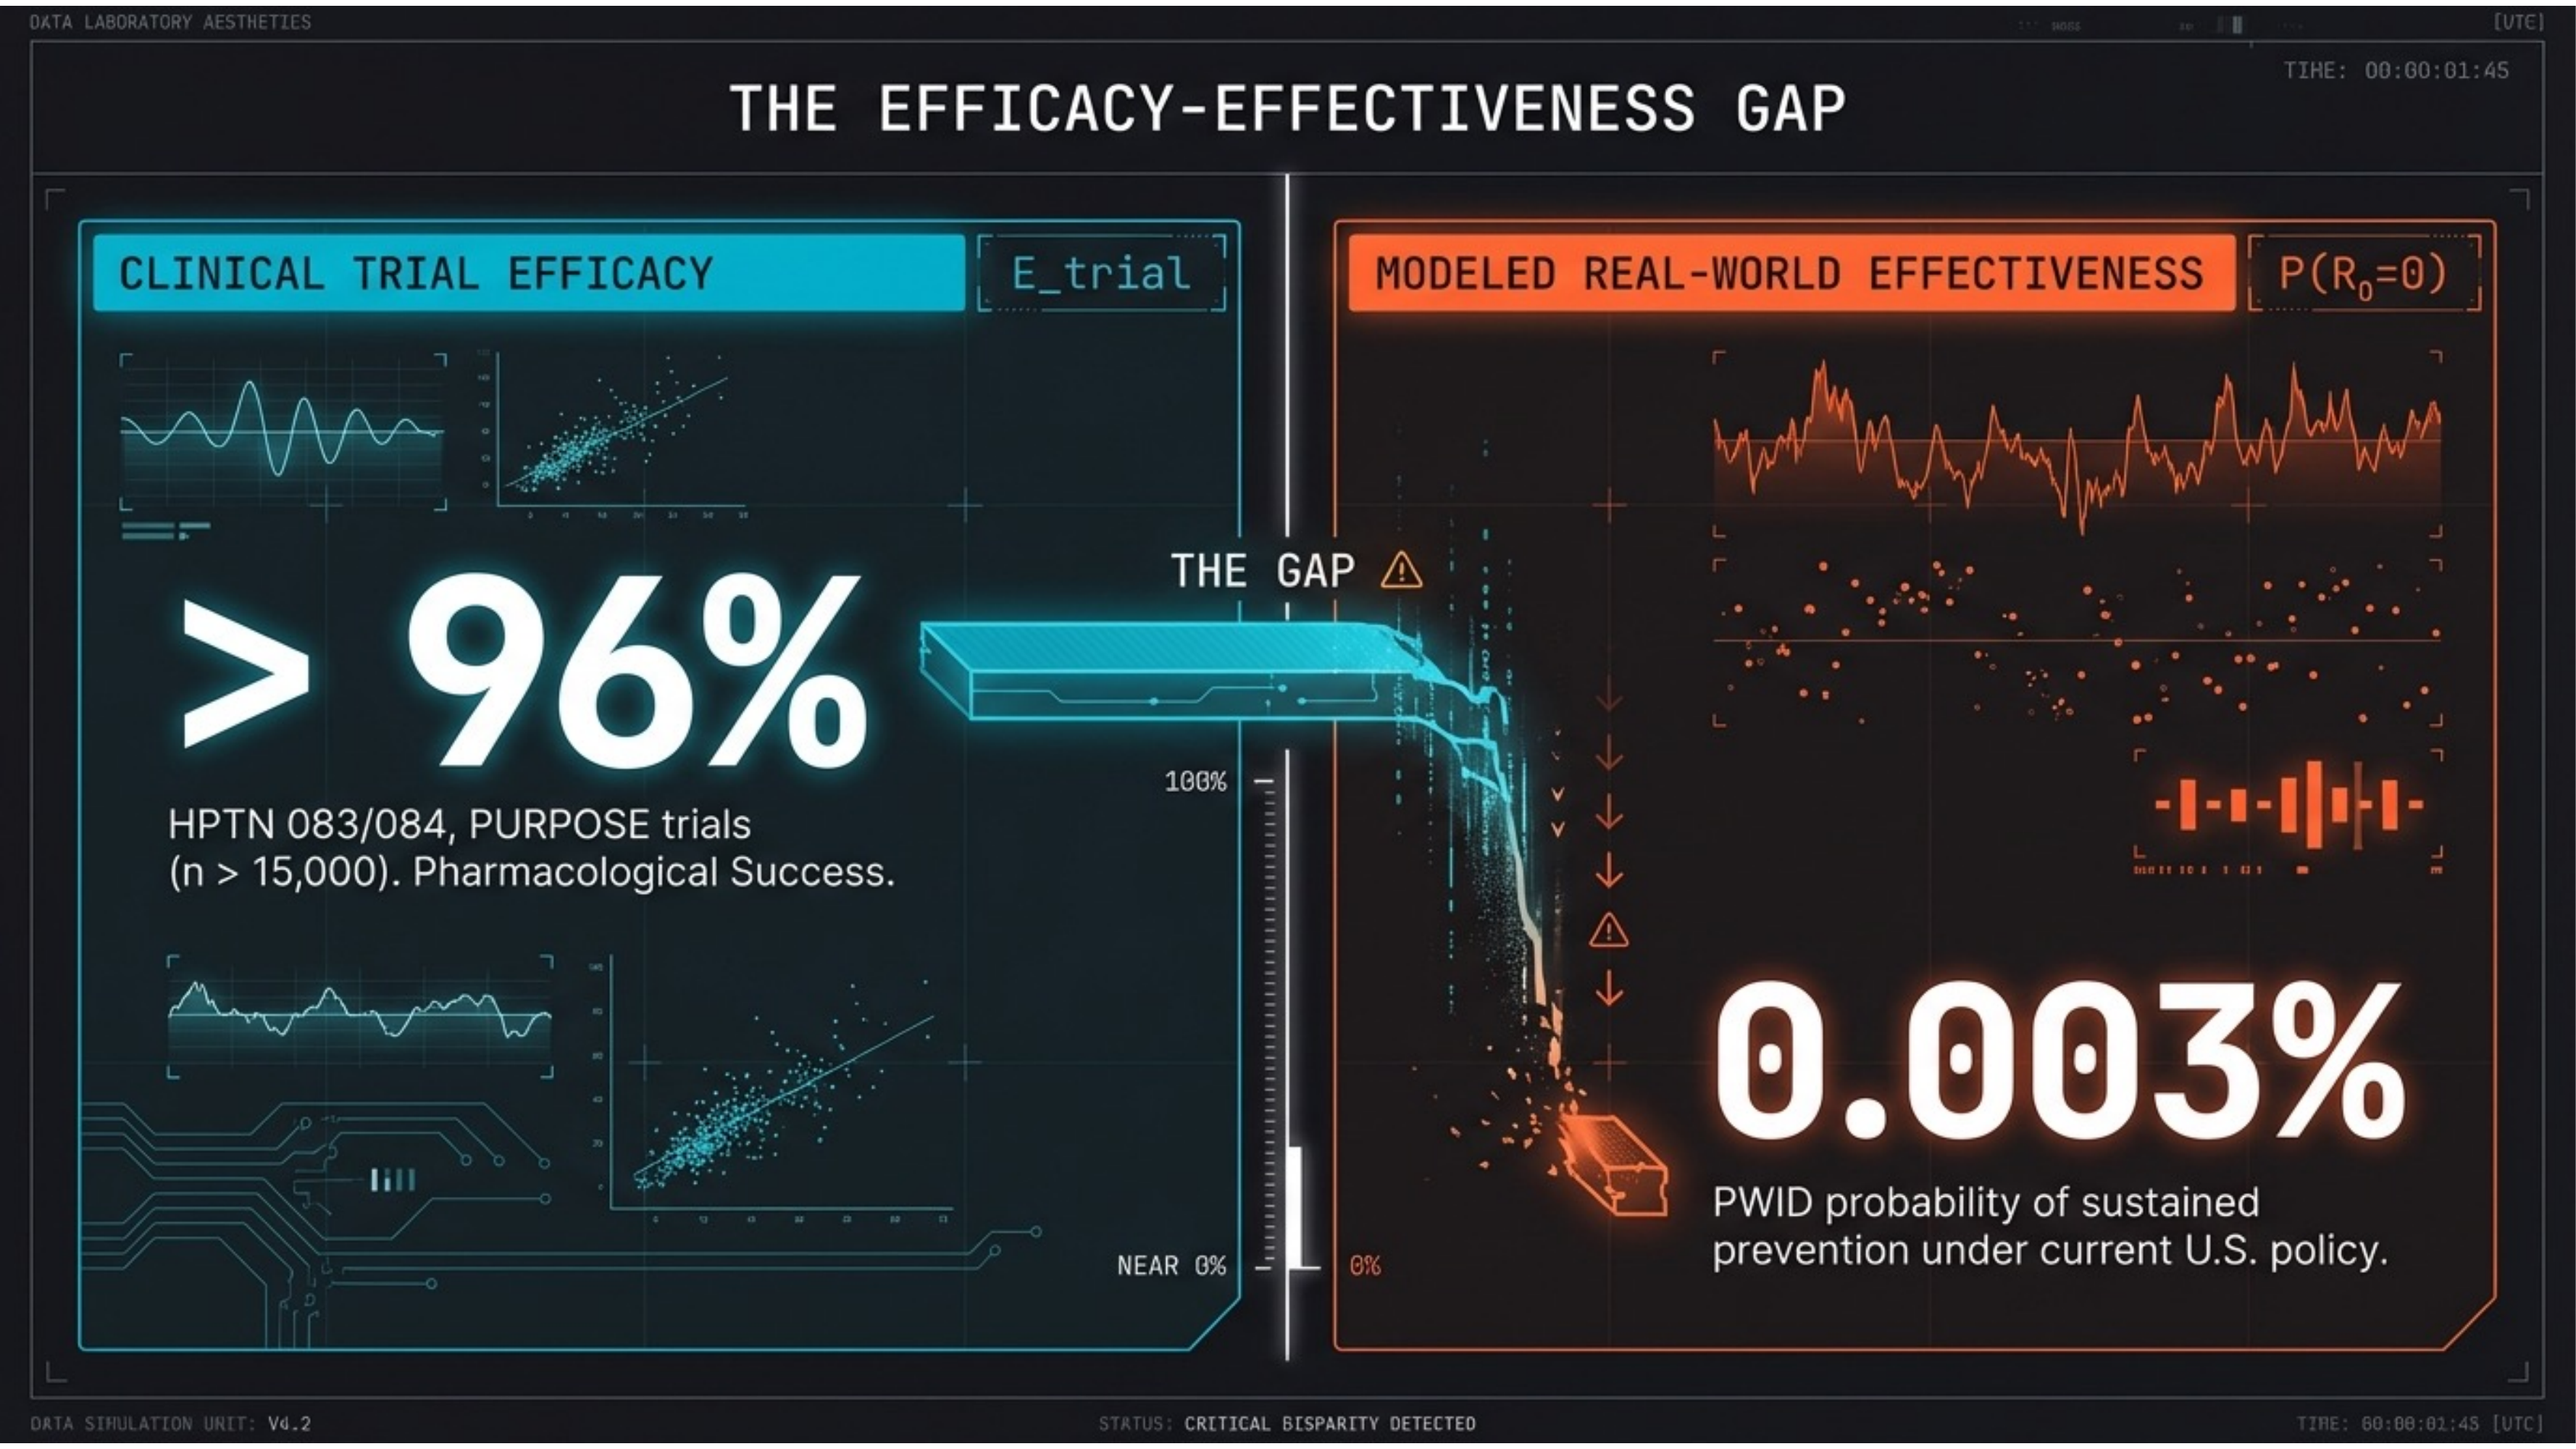
A drug that works — in a system that doesn’t. Clinical trials (HPTN 083/084, PURPOSE) show >96% efficacy in n > 15,000. Yet modeled real-world effectiveness for PWID is 0.003%. The gap is not pharmacological — it is architectural.
Slide 03 — Systemic Disparity
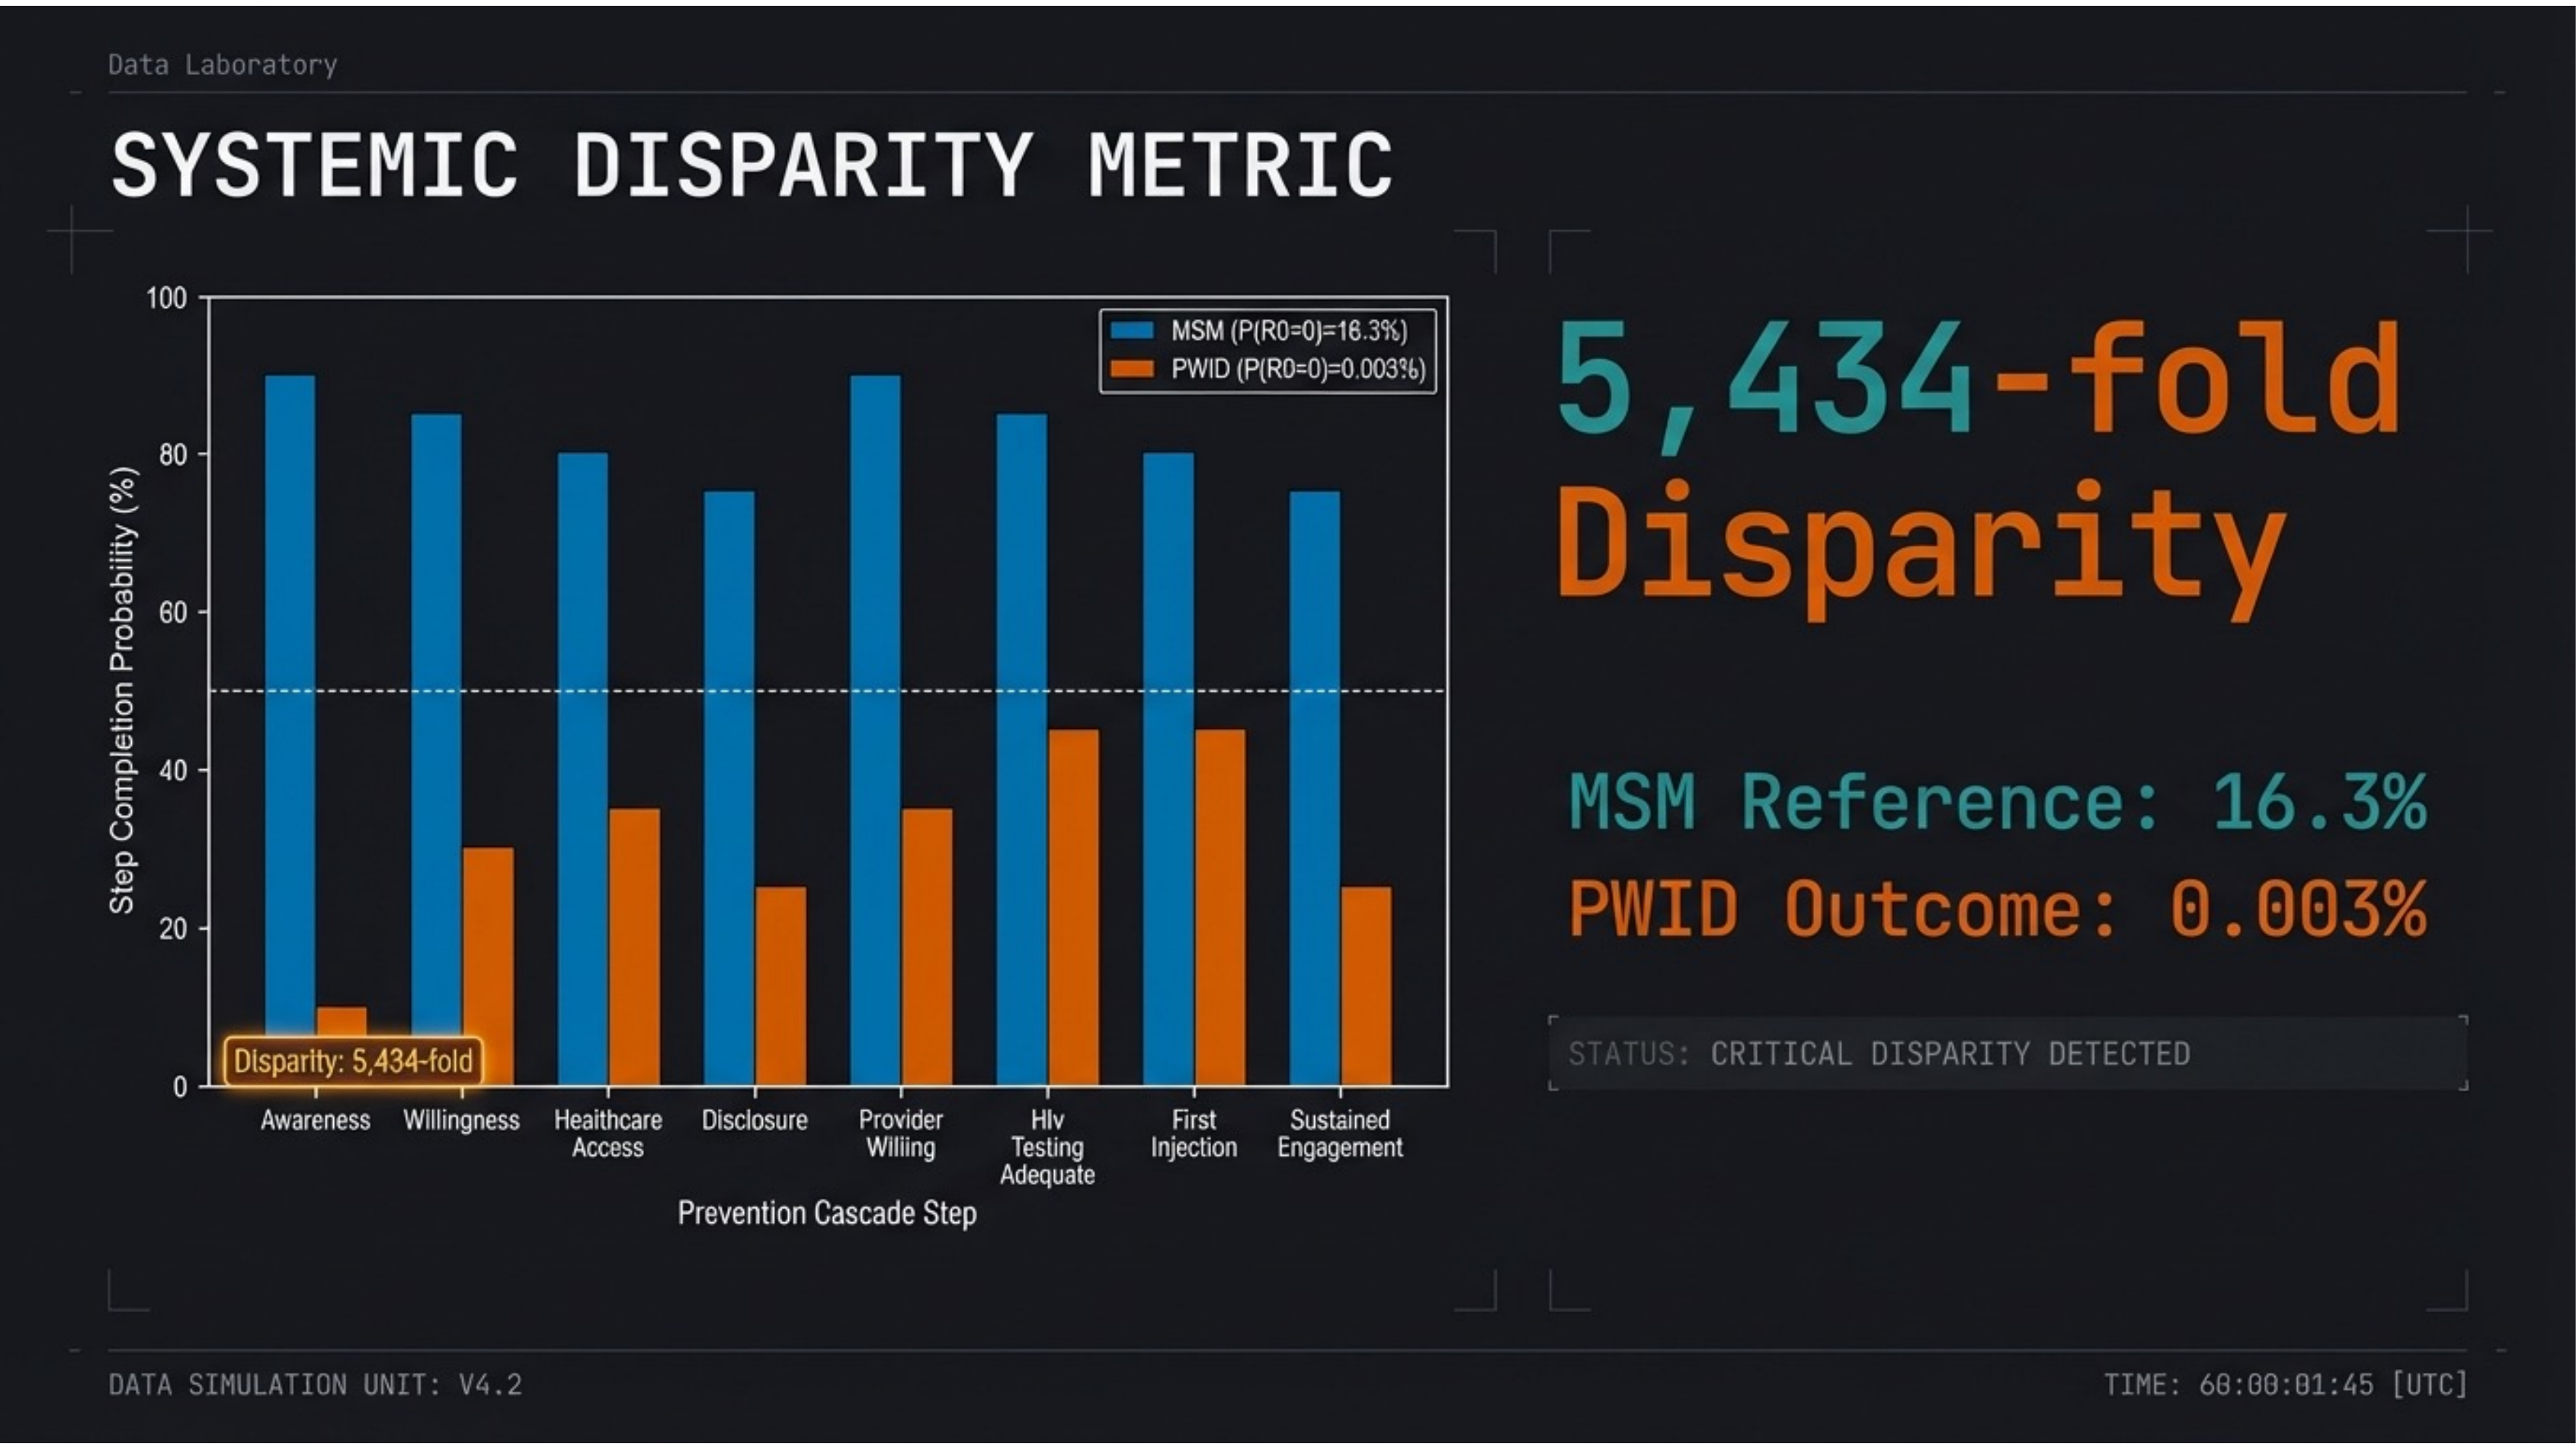
A 5,434-fold disparity. MSM reference population achieves 16.3% sustained prevention probability. PWID outcome: 0.003%. At every step of the cascade, PWID fall below 50% probability while MSM maintain above 50% at all steps.
Slide 04 — Investigational Hypothesis
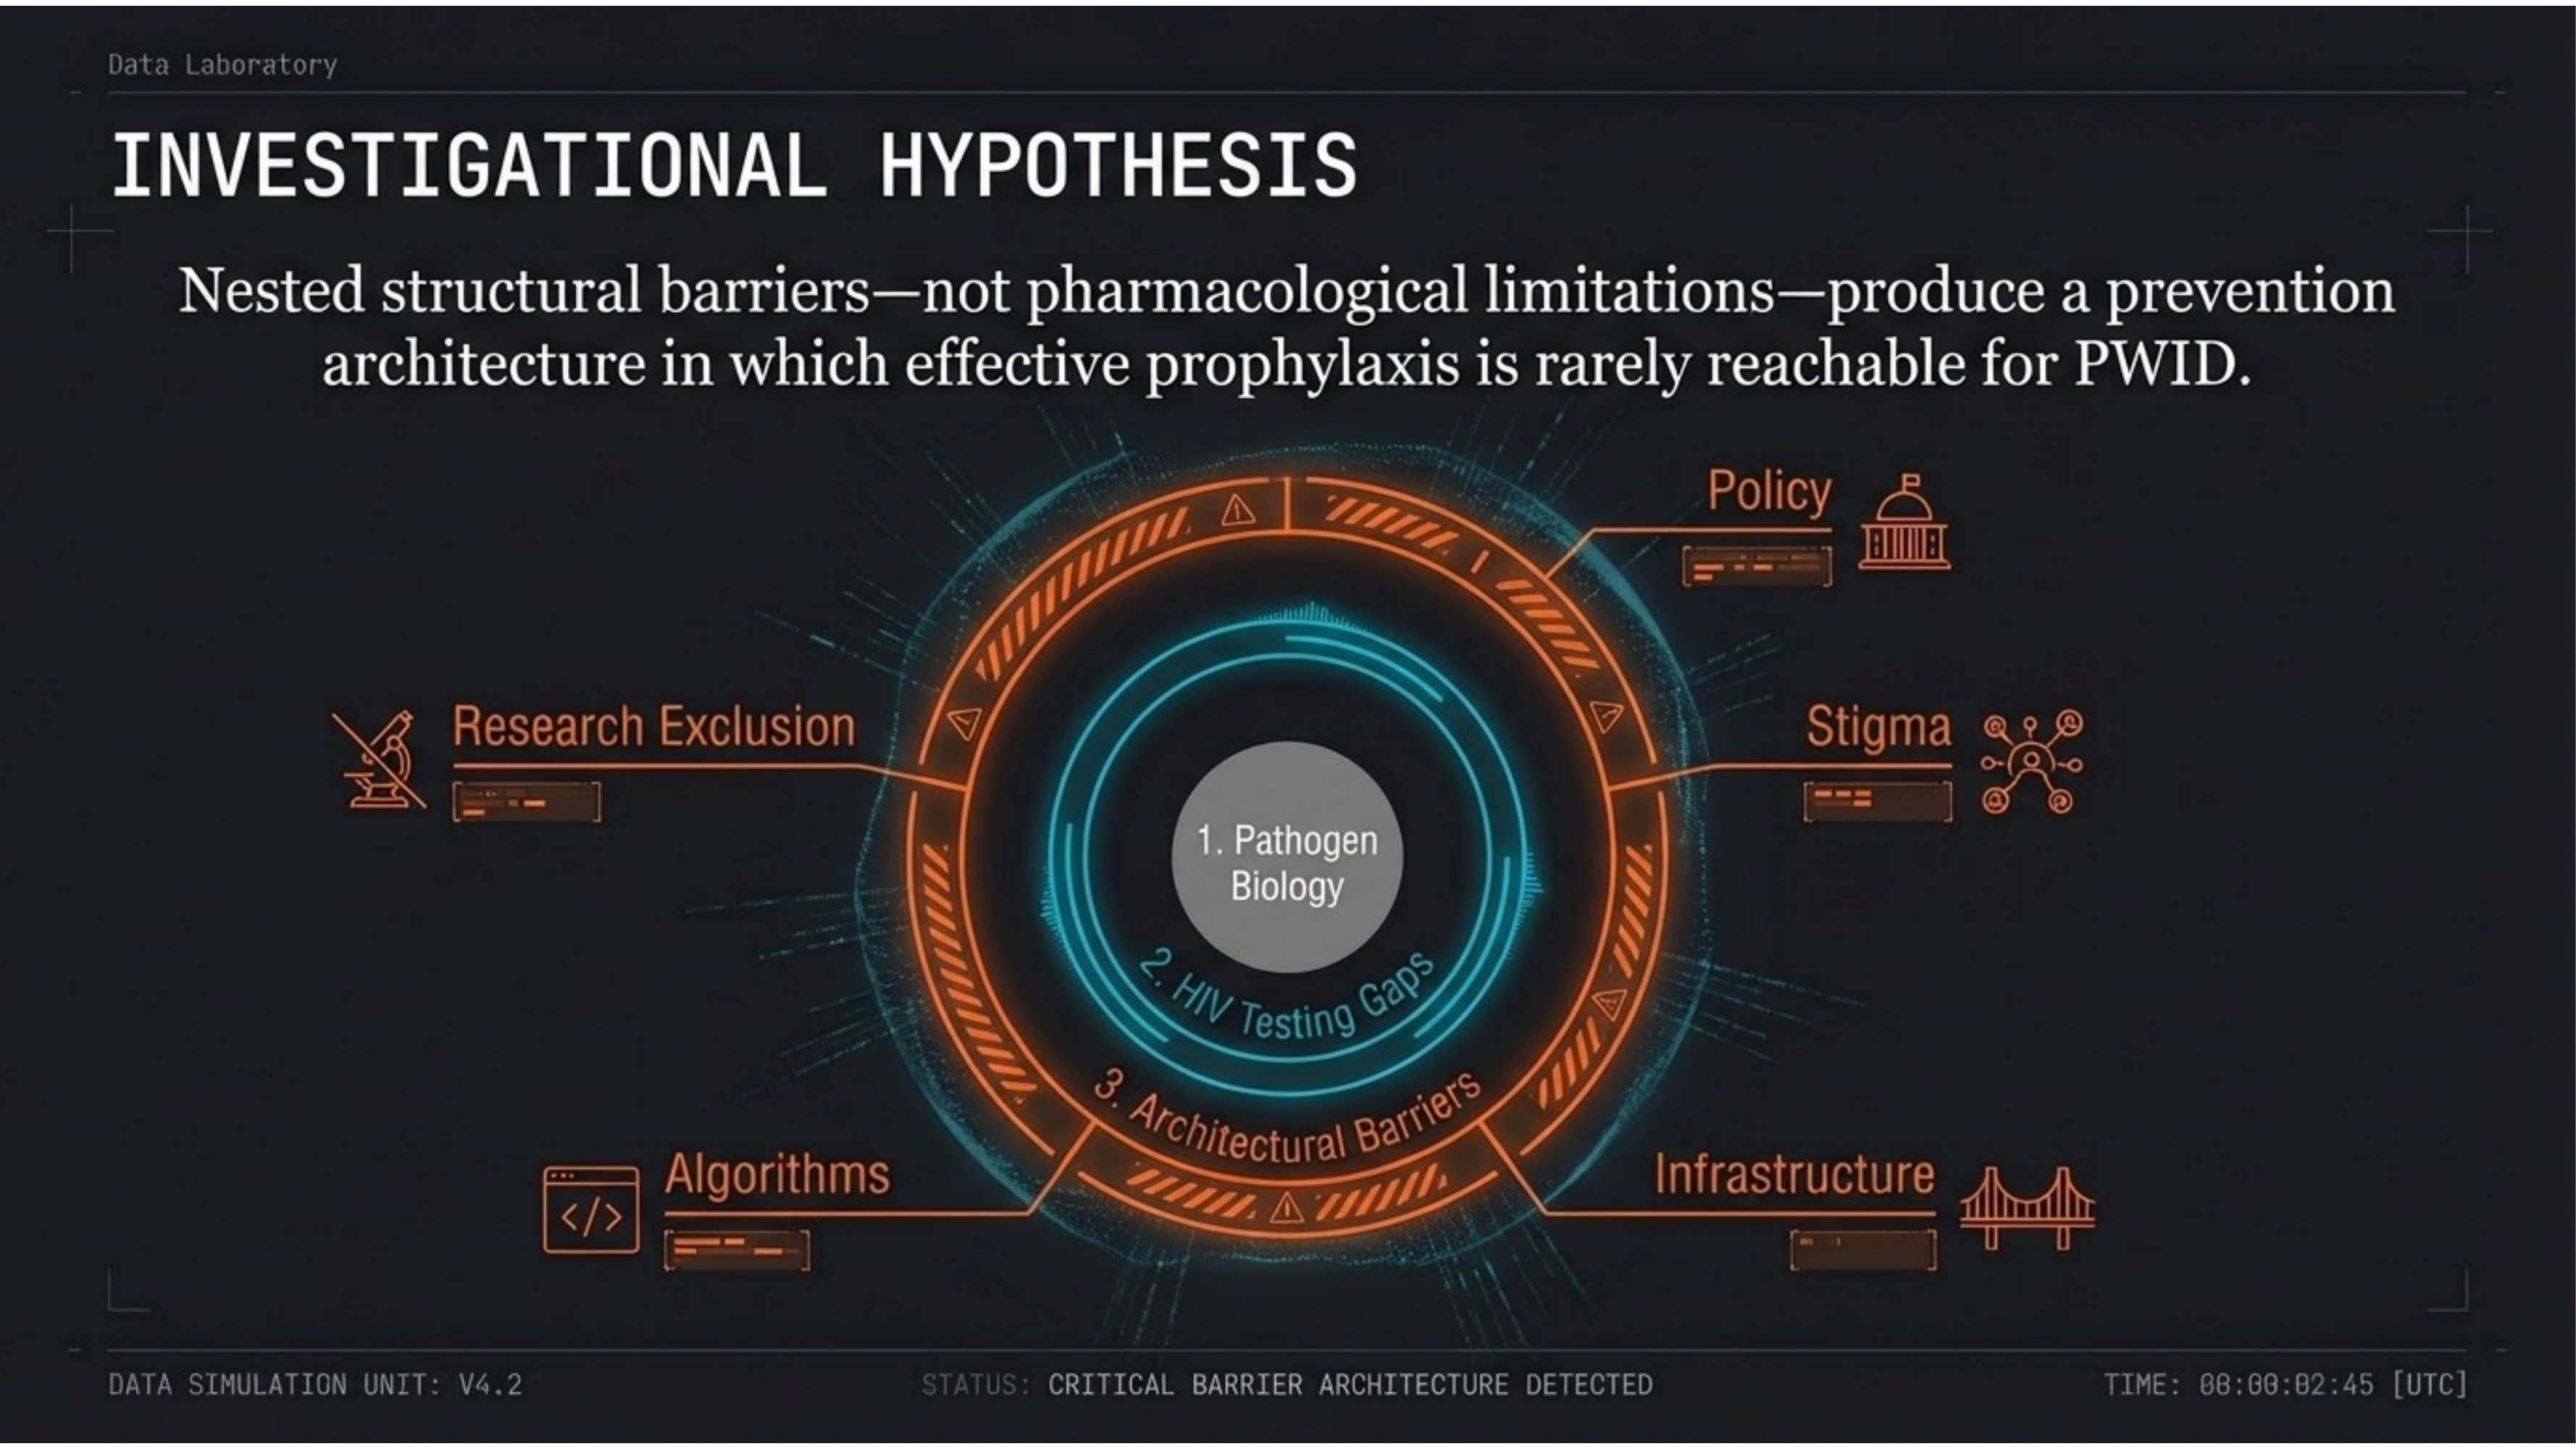
Nested structural barriers — not pharmacological limitations — produce an unreachable prevention architecture. Policy, stigma, infrastructure, algorithms, and research exclusion form concentric rings around the biological core, each amplifying the others.
Slide 05 — The Prevention Cascade
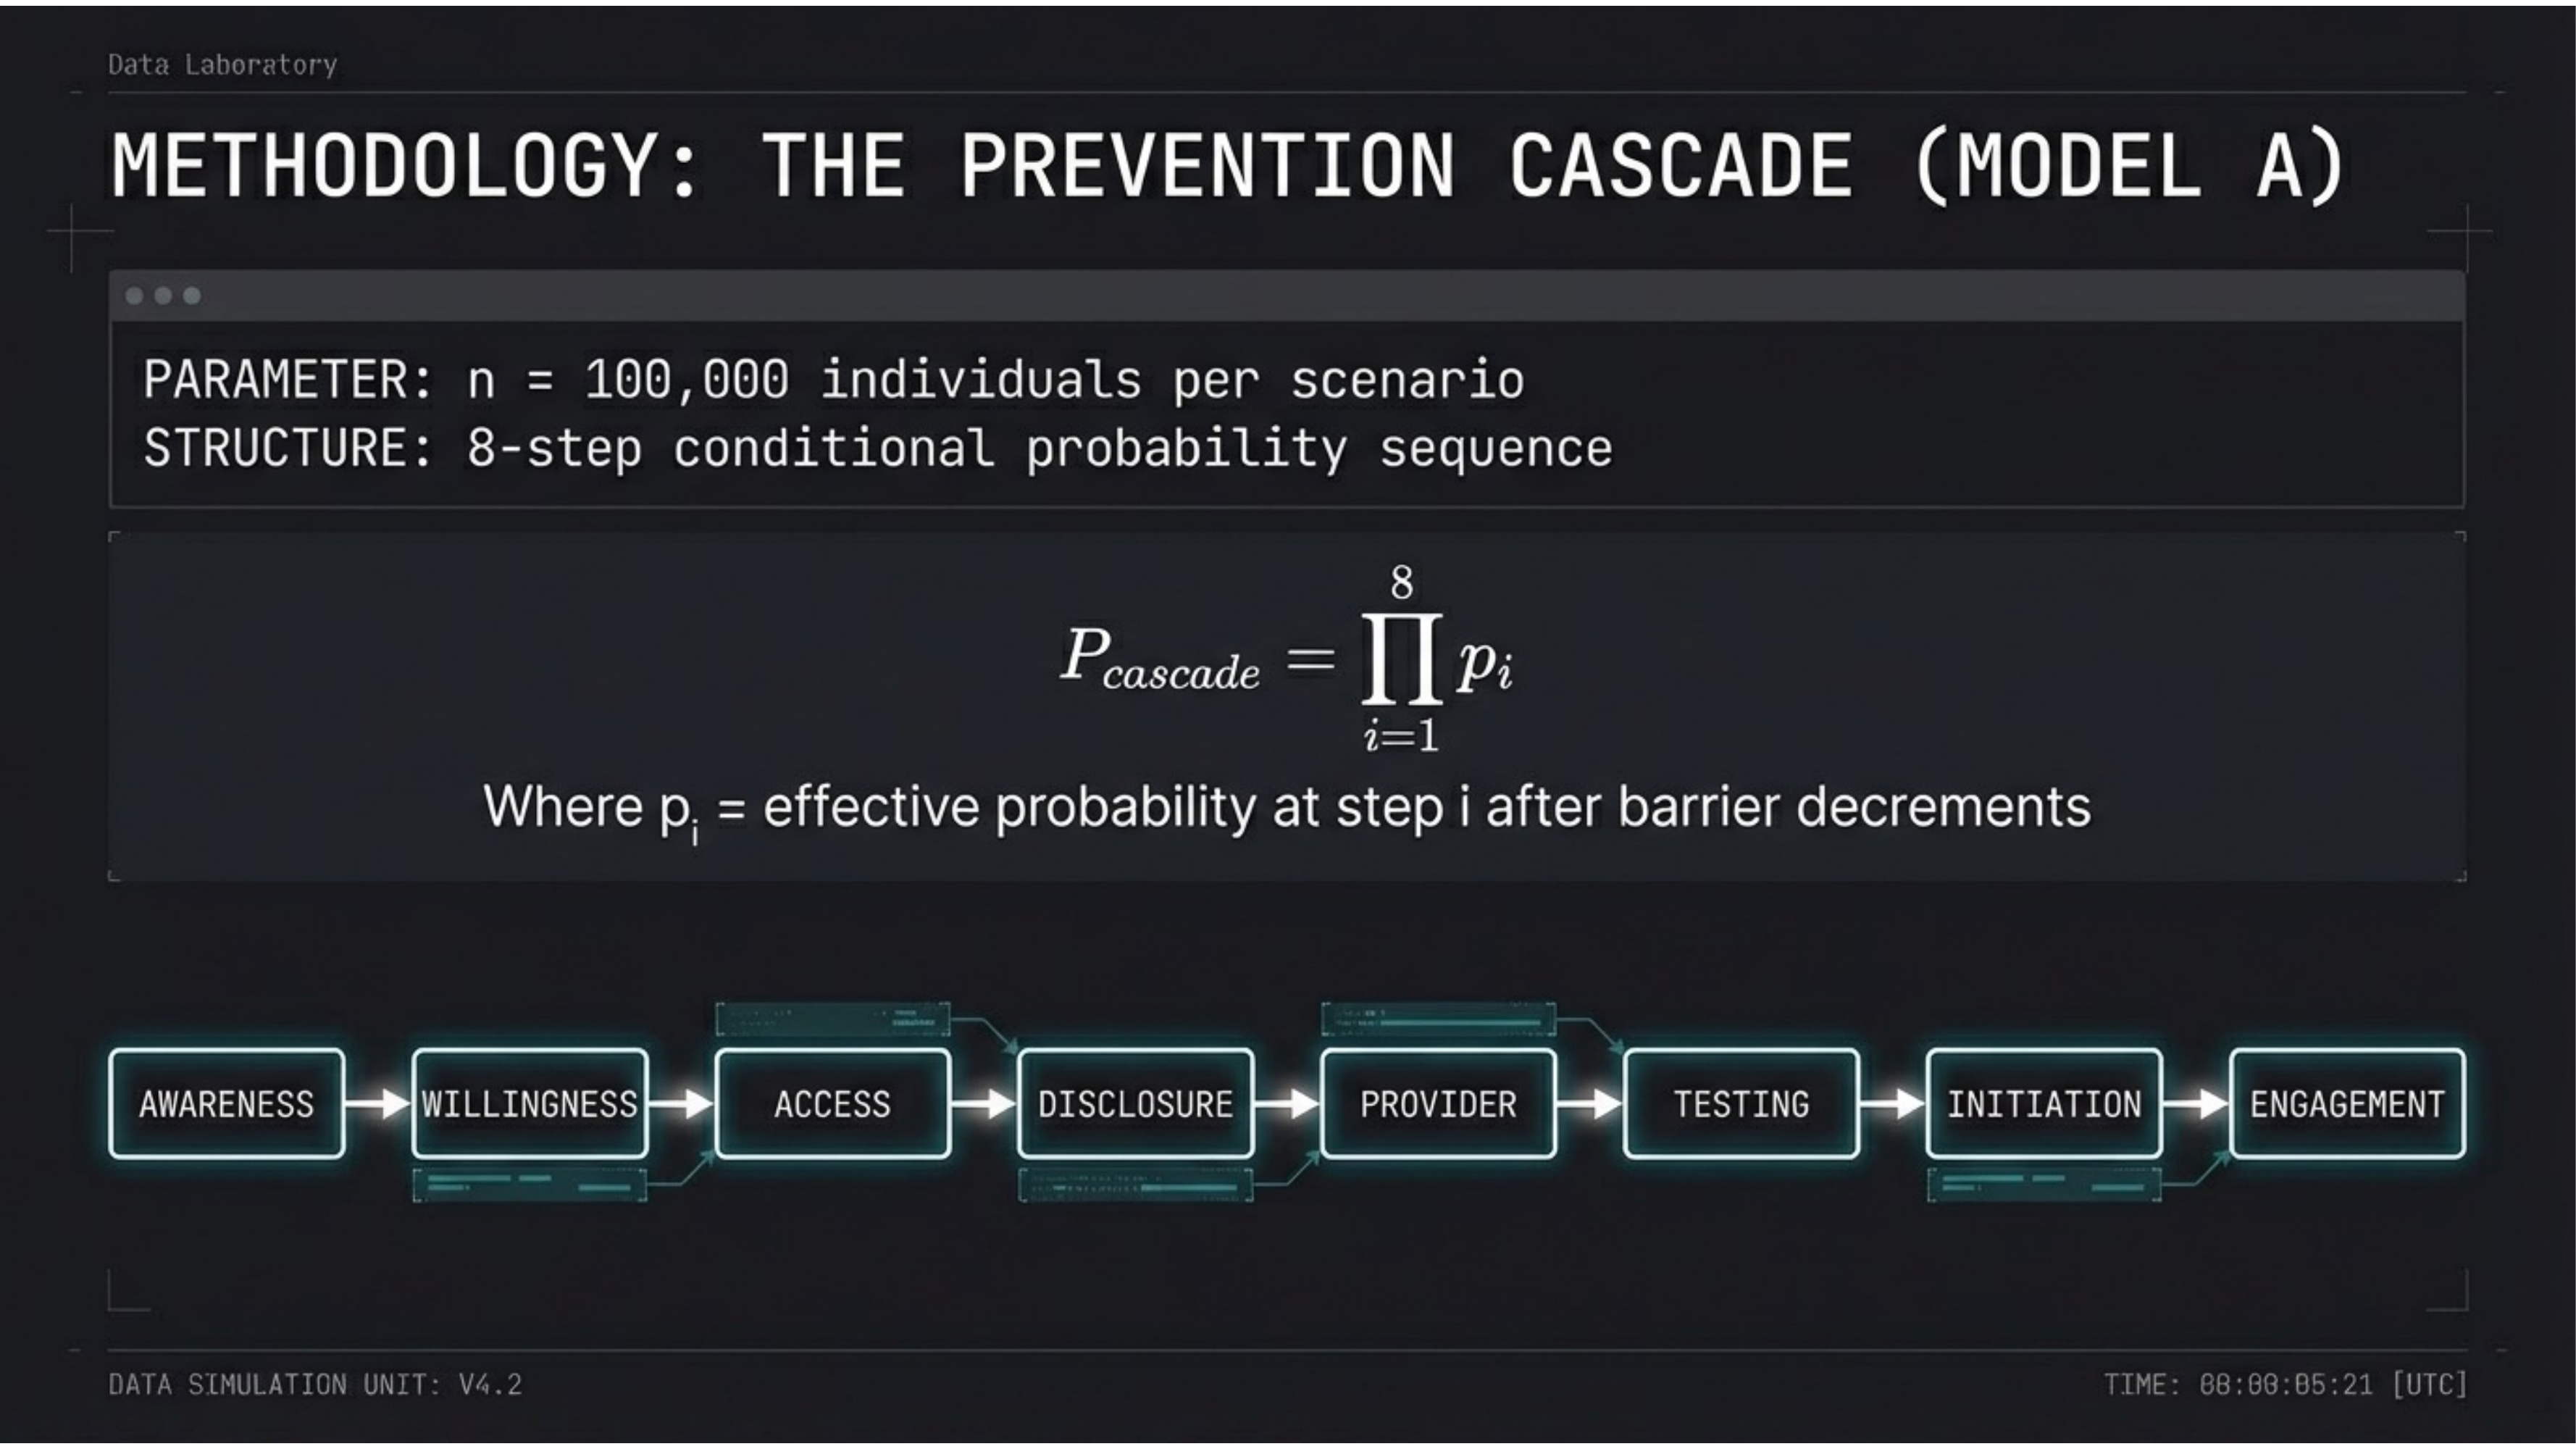
Model A: An 8-step conditional probability sequence. n = 100,000 individuals per scenario. Pcascade = ∏ pi from i=1 to 8. The steps: Awareness → Willingness → Access → Disclosure → Provider → Testing → Initiation → Engagement.
Slide 06 — Step Probabilities
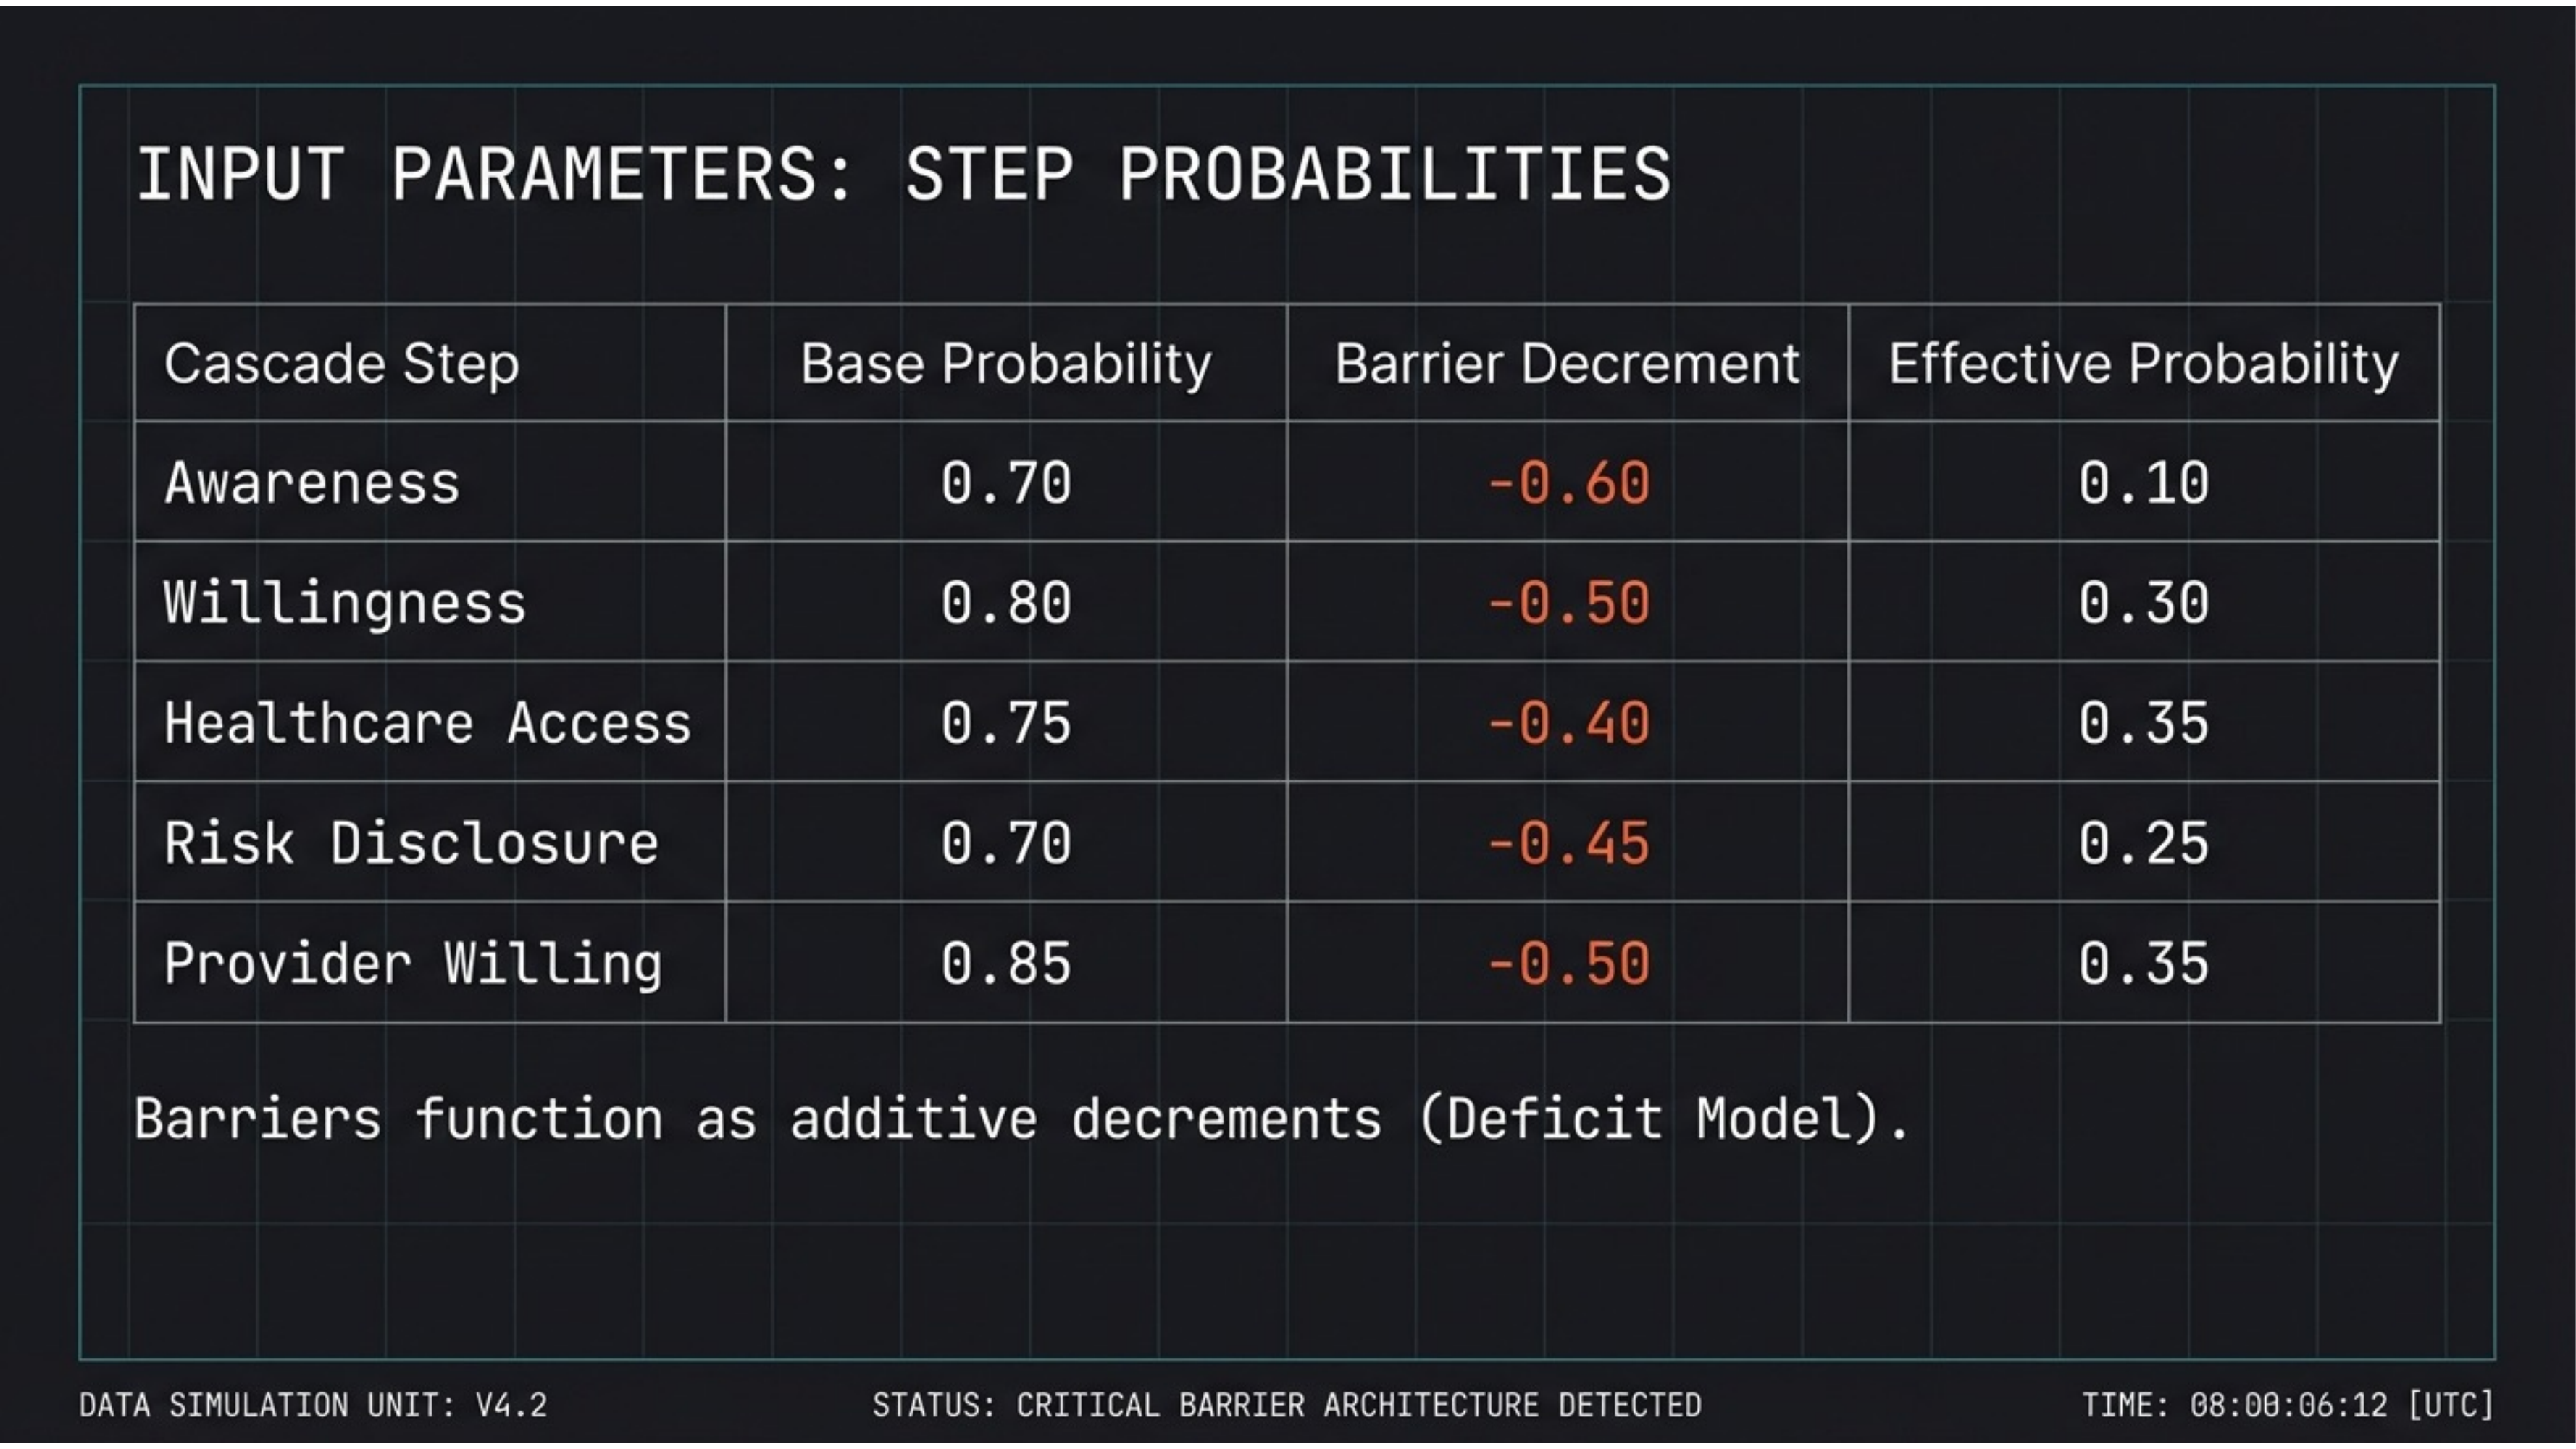
Barriers function as additive decrements. Each cascade step has a base probability (0.70–0.85) reduced by structural barrier decrements (-0.40 to -0.60). Awareness drops from 0.70 to an effective 0.10. Even willingness (base 0.80) collapses to 0.30.
Slide 07 — Probability Attrition
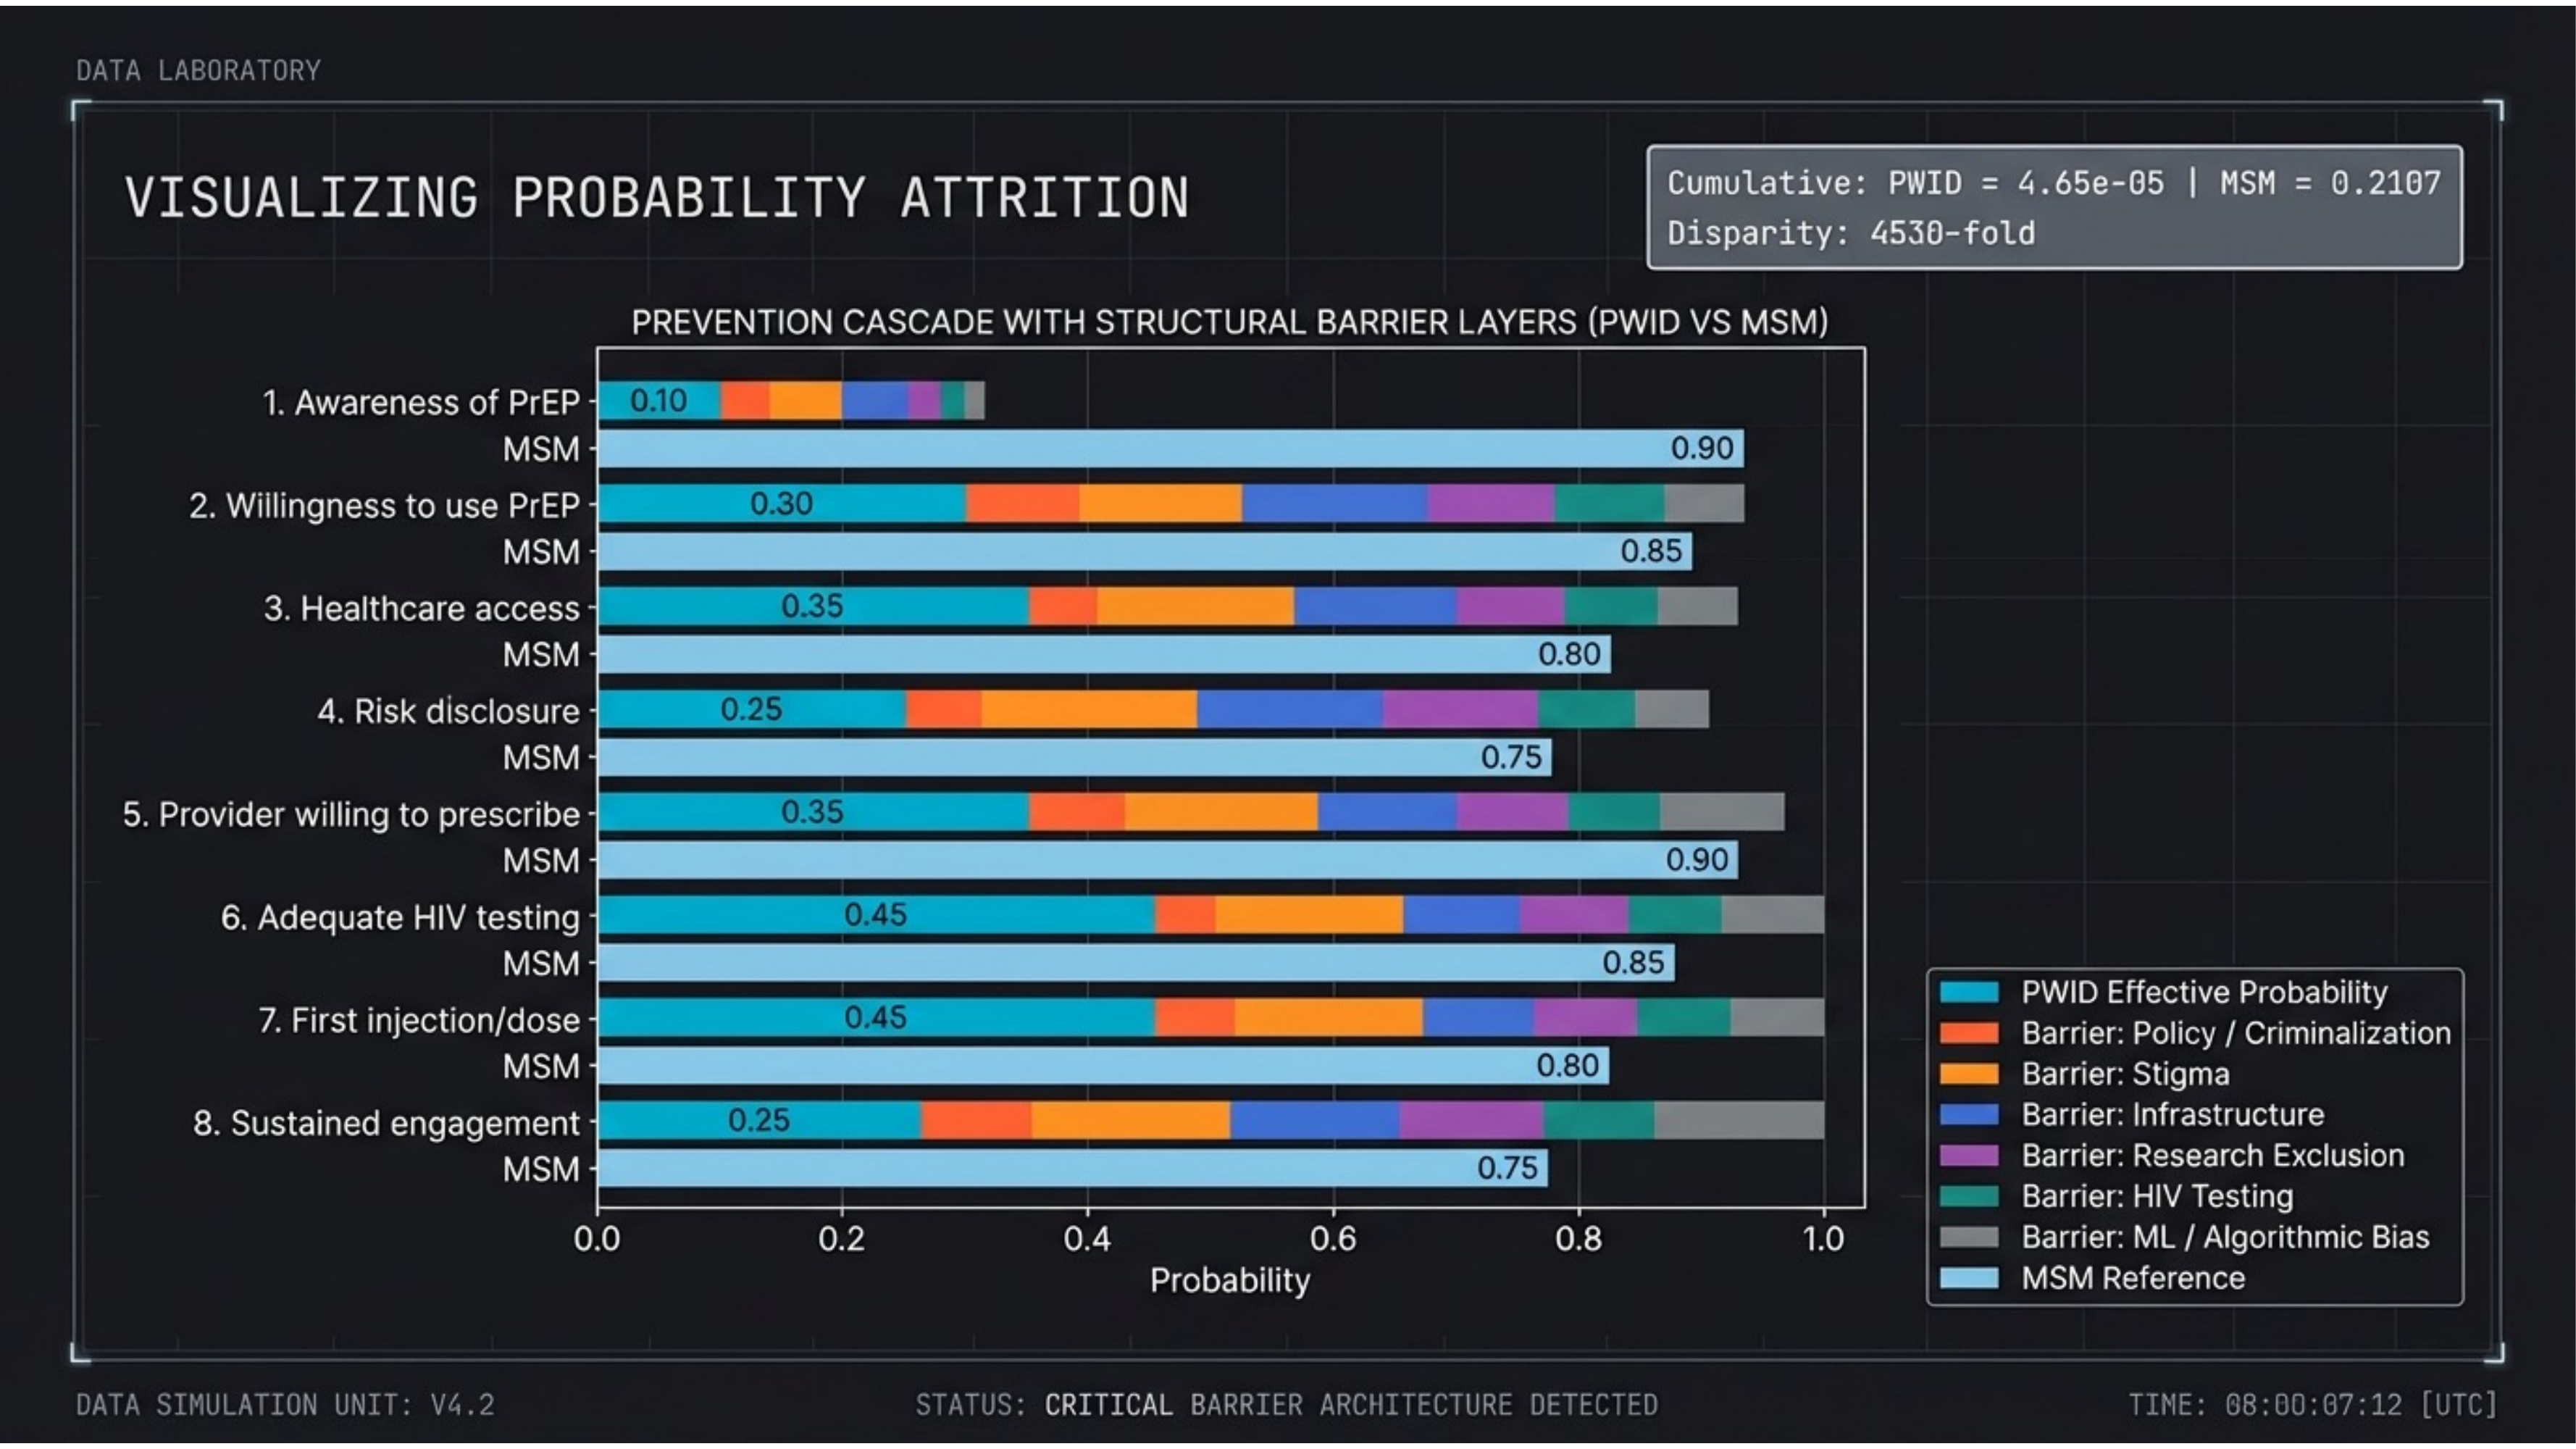
Visualizing where prevention collapses. Stacked barrier layers (policy/criminalization, stigma, infrastructure, research exclusion, HIV testing, ML/algorithmic bias) erode probability at every step. Cumulative PWID outcome: 4.65 × 10⁻⁵ vs. MSM: 0.2107 — a 4,530-fold disparity.
Slide 08 — Population Comparison
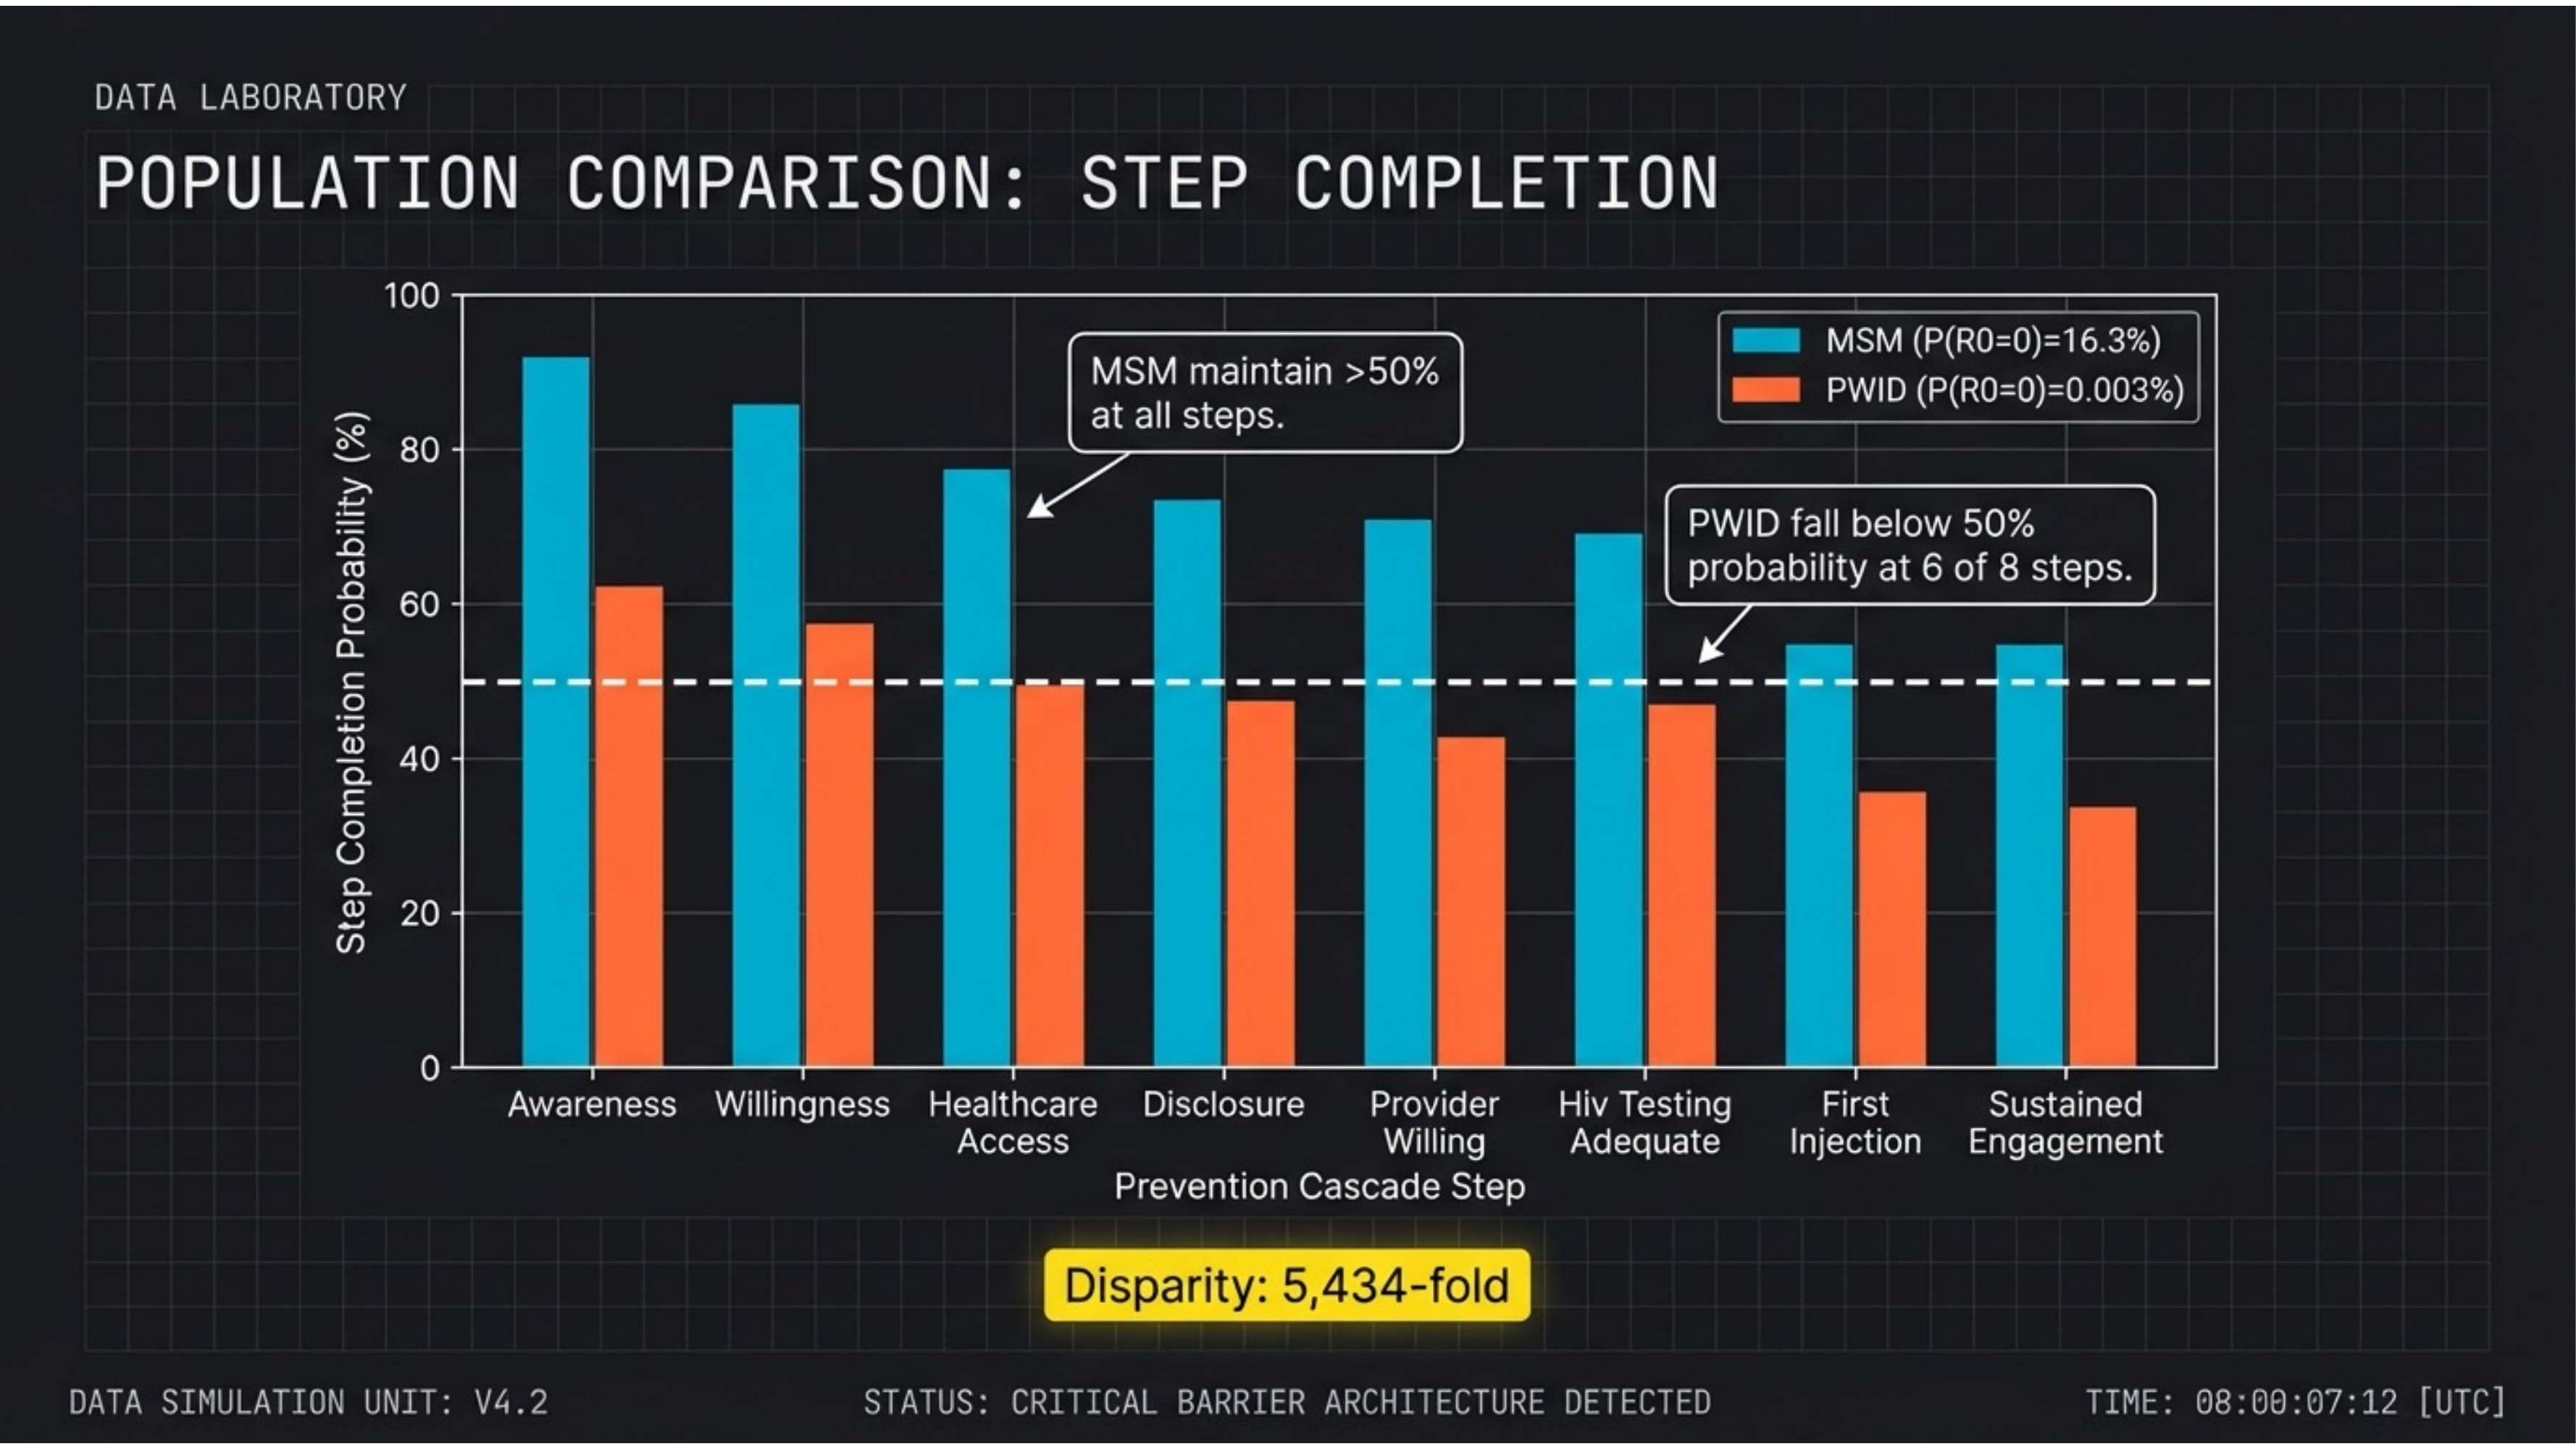
MSM maintain >50% at all steps. PWID fall below 50% at 6 of 8. The bar chart makes the structural disparity visible: identical pharmacology, radically different outcomes. The 5,434-fold disparity emerges from multiplicative barrier compounding.
Slide 09 — Decomposition of Failure
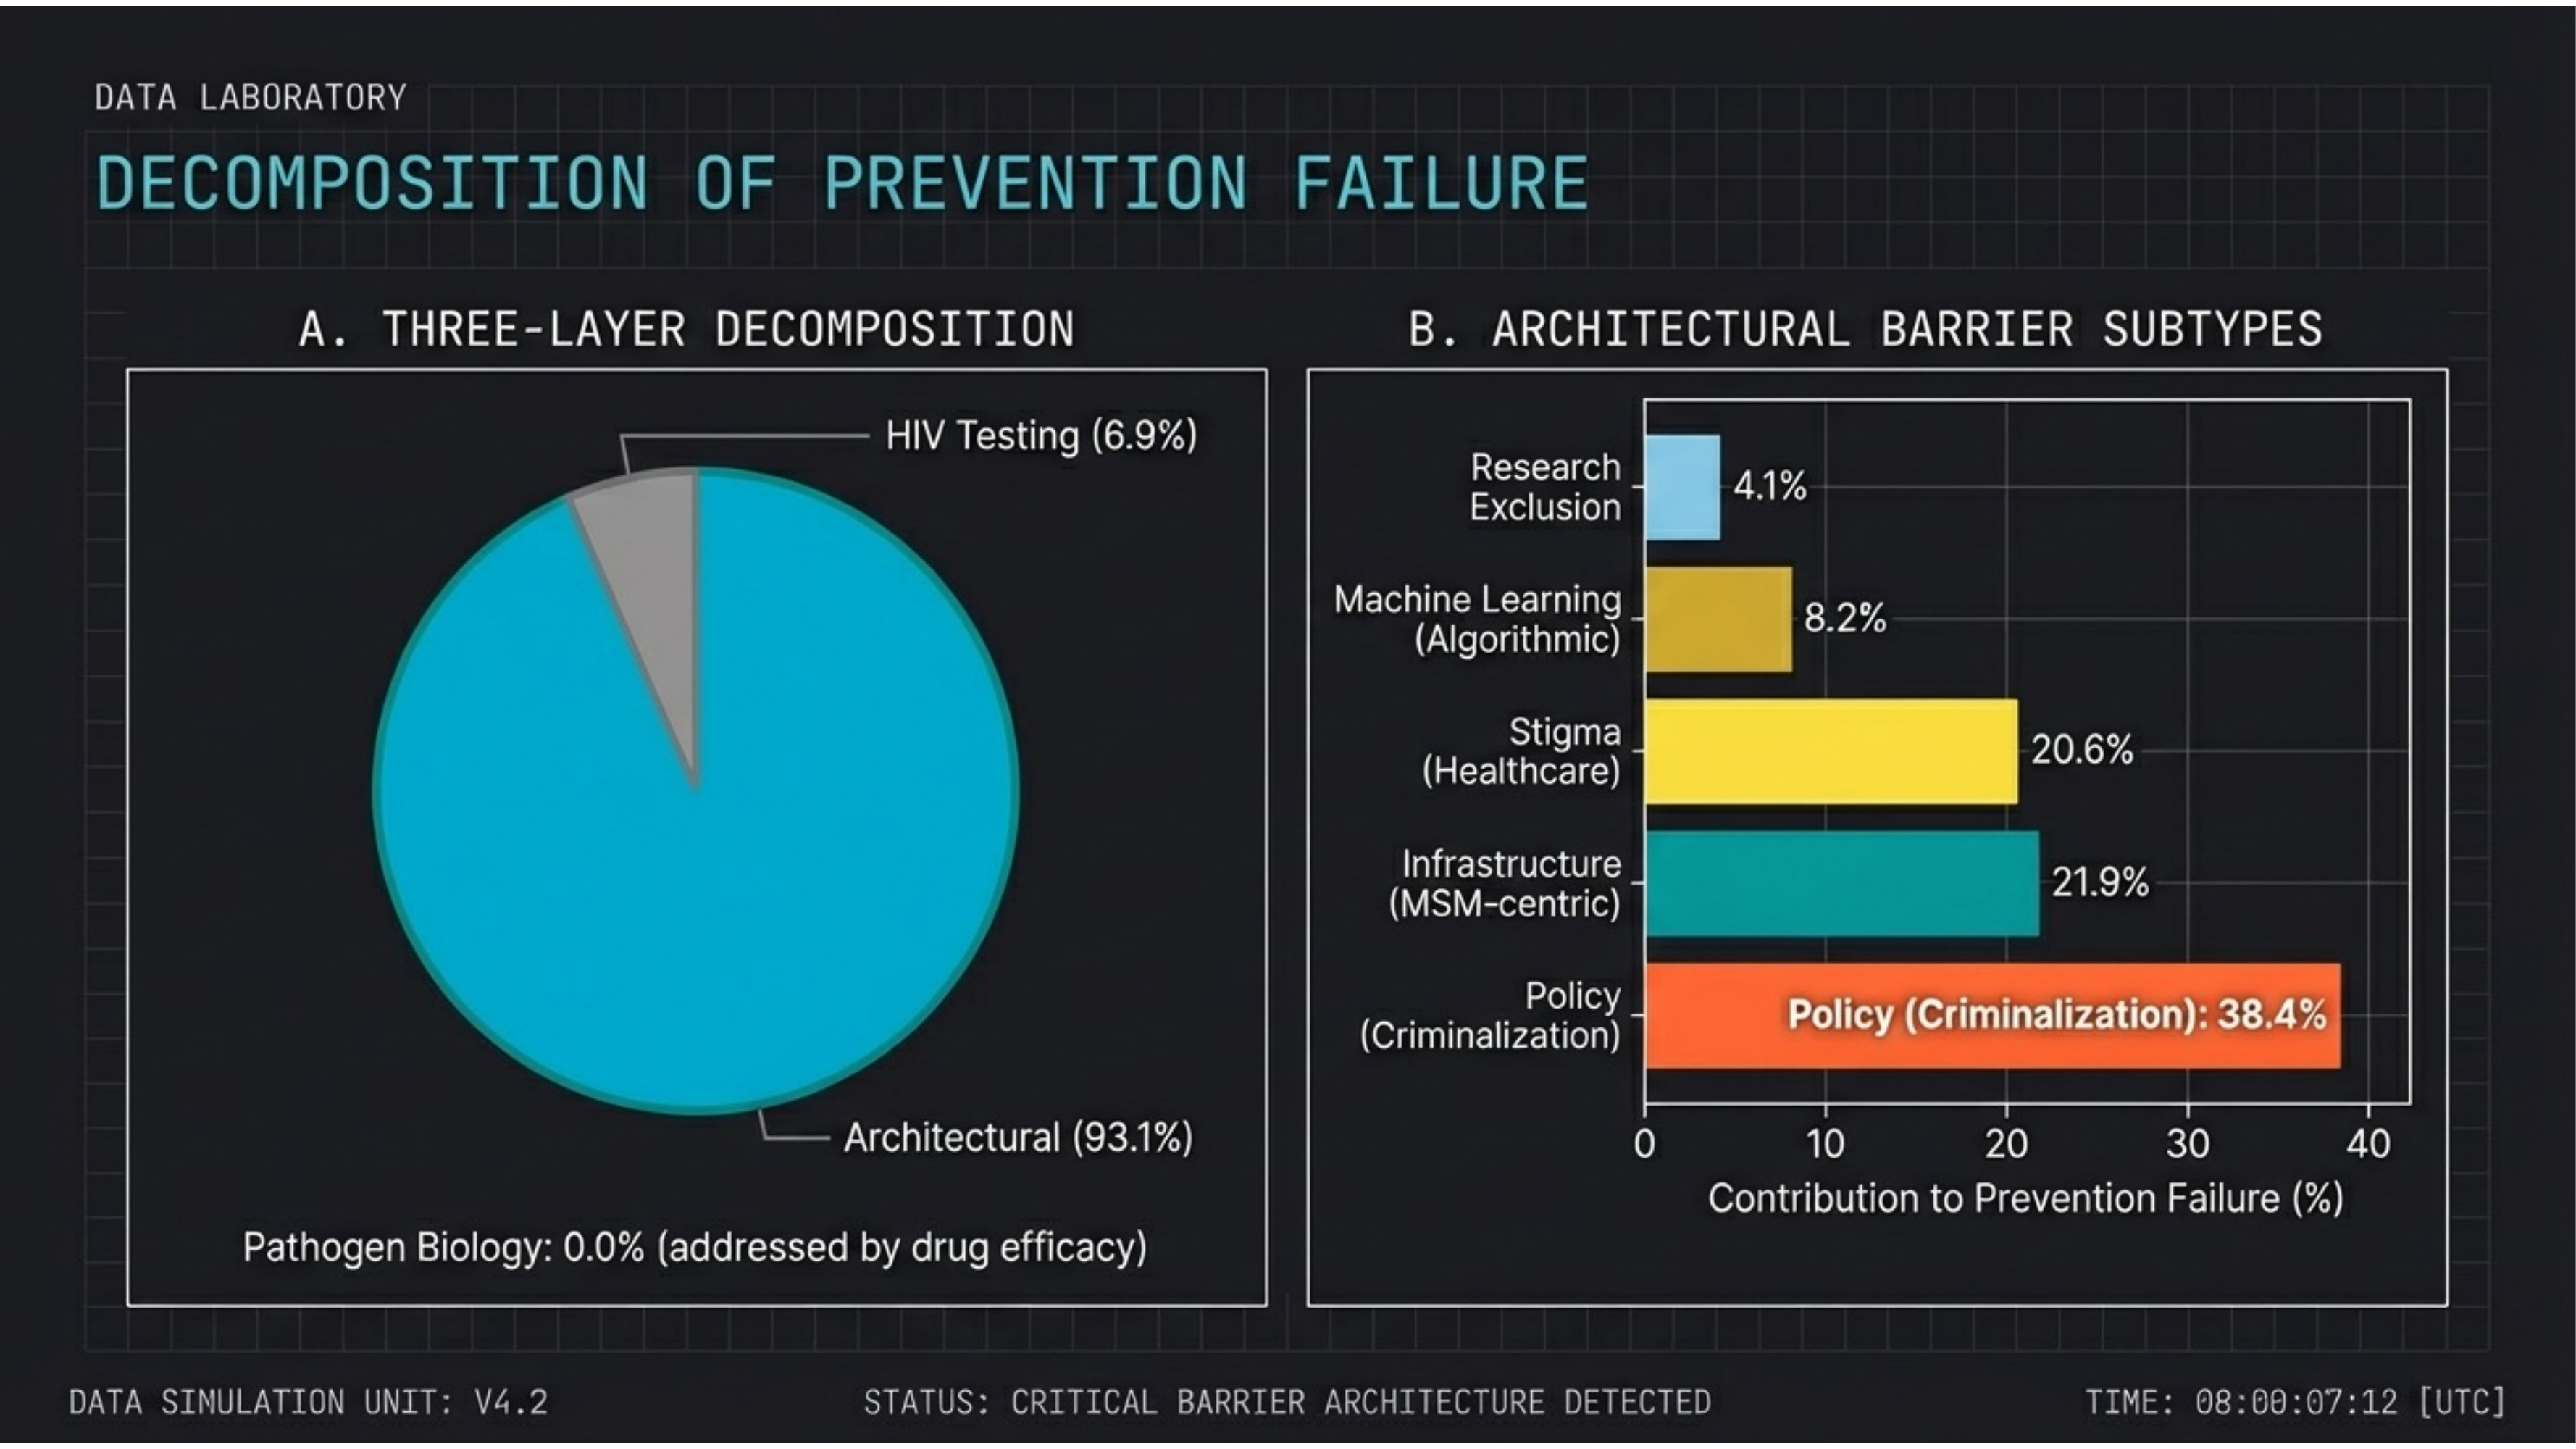
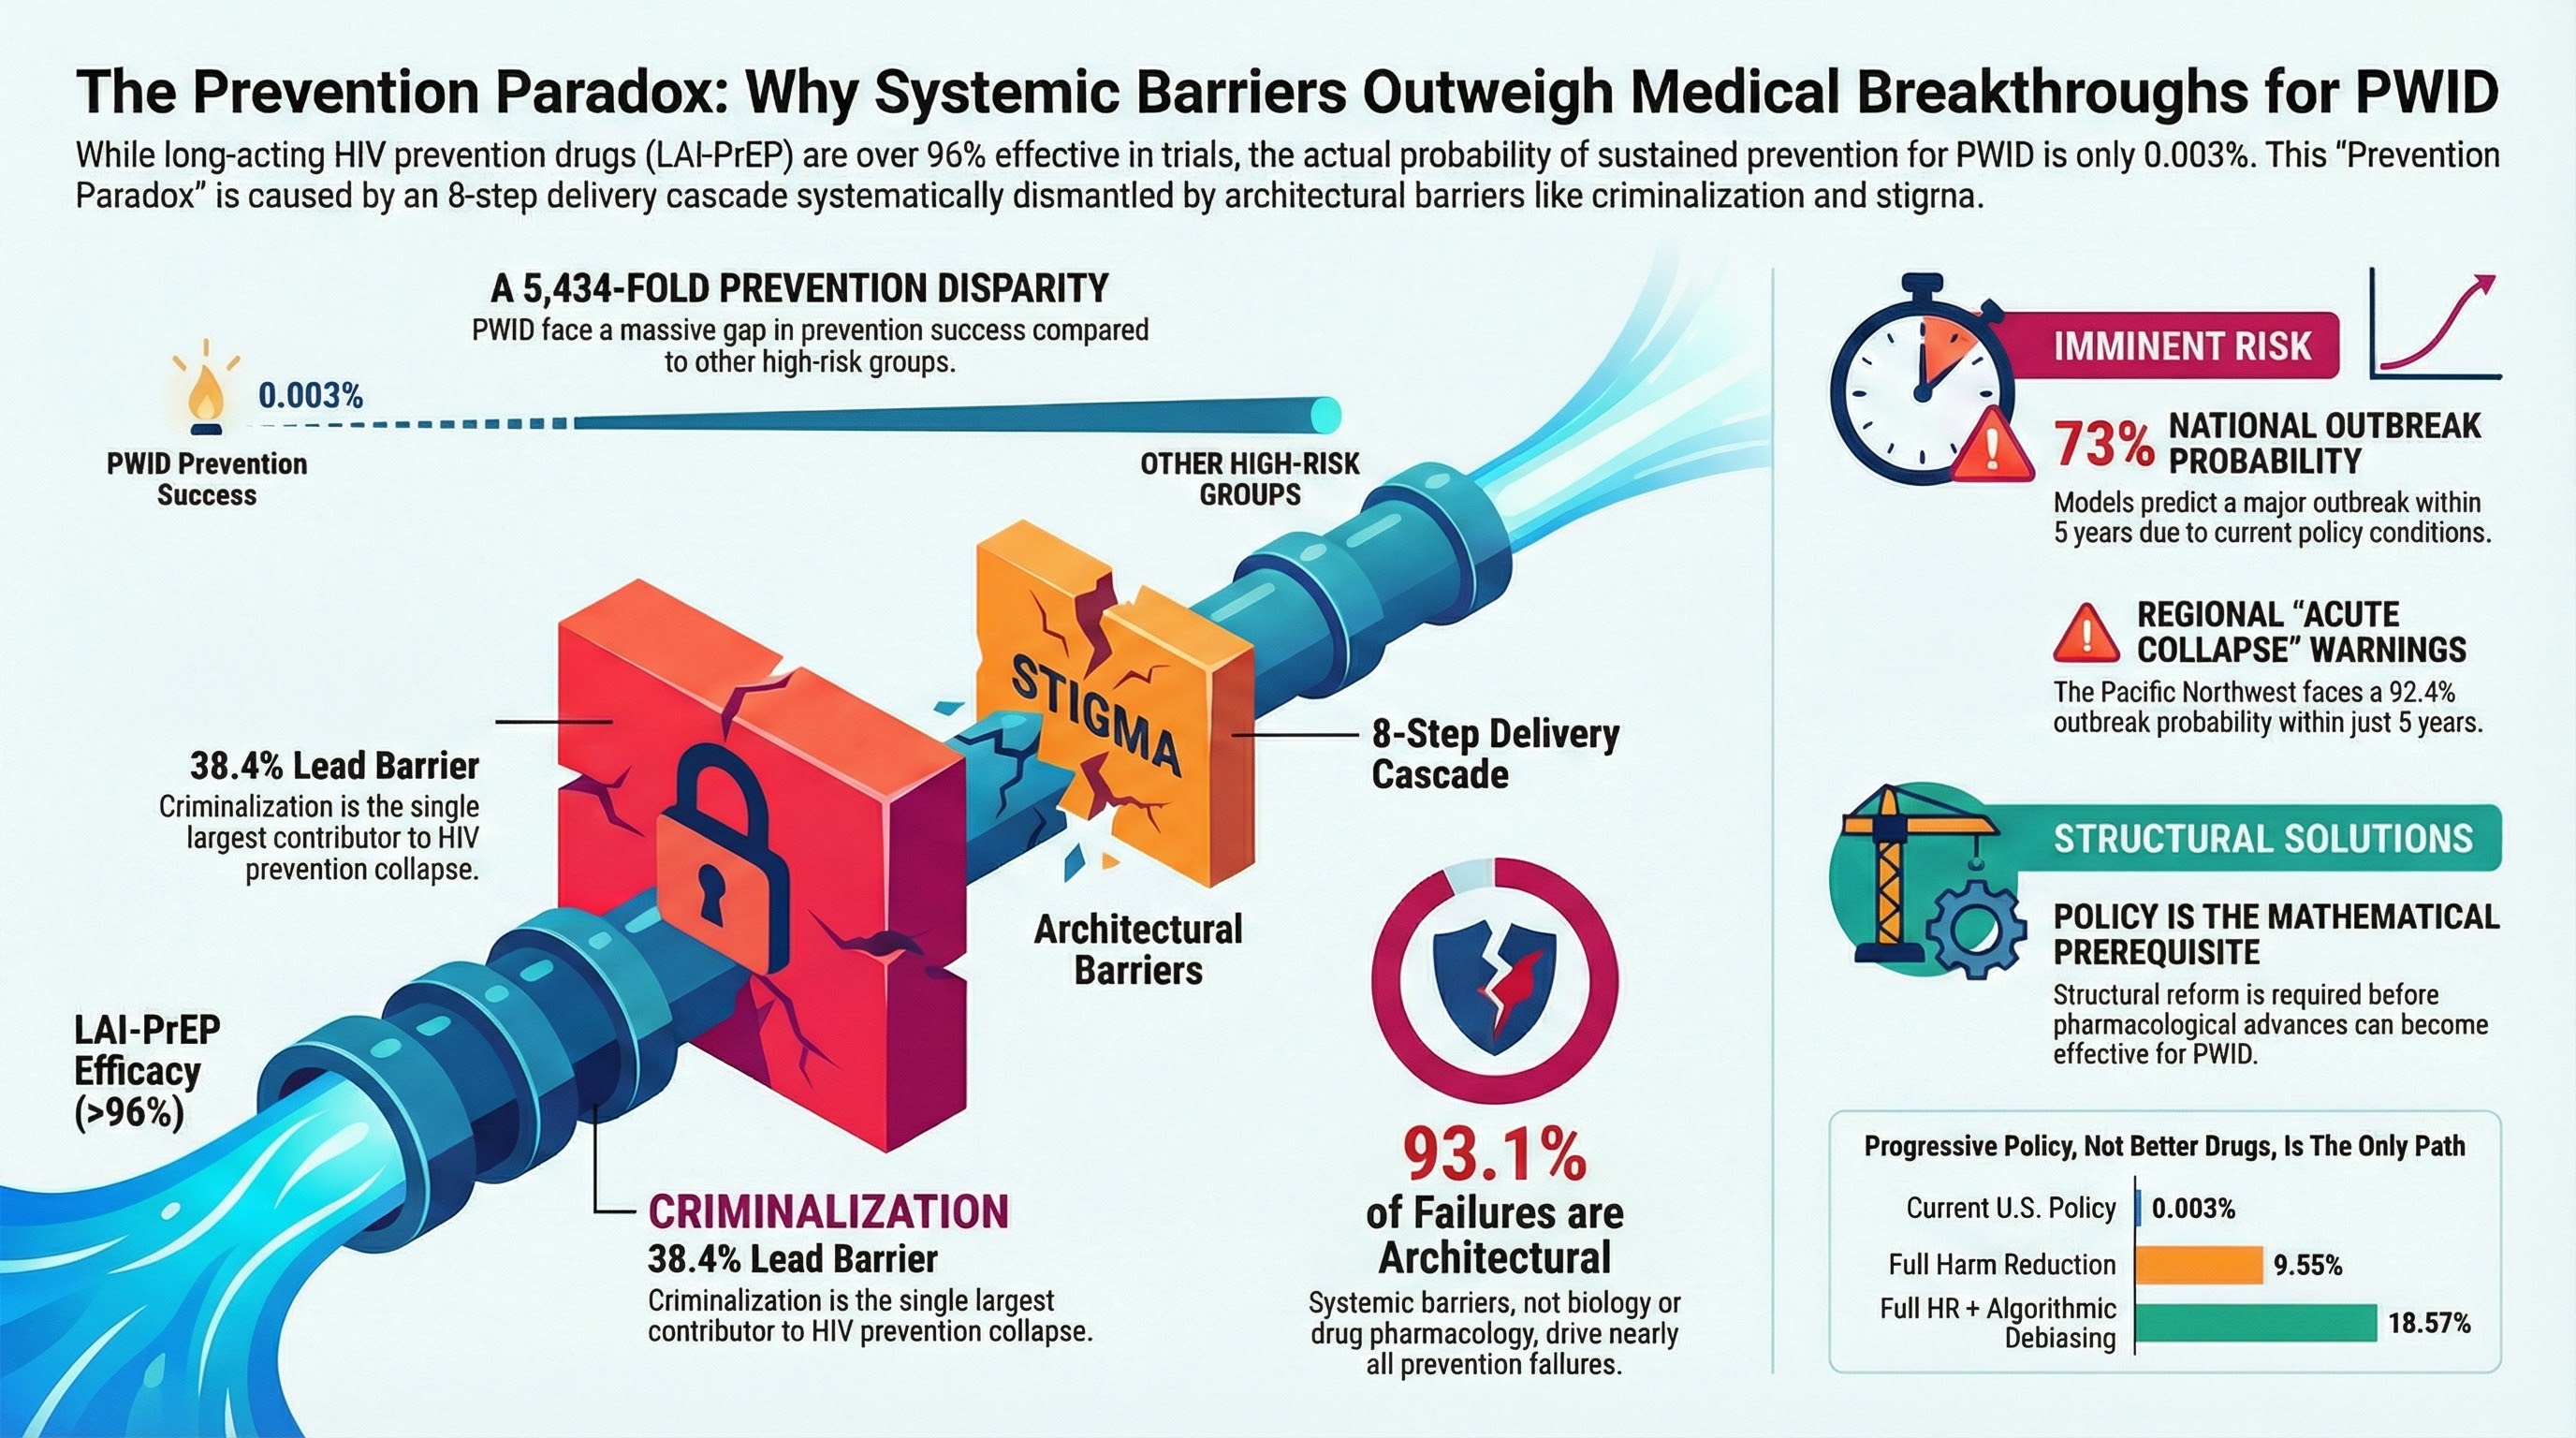
93.1% of prevention failures are architectural. Three-layer decomposition: Pathogen biology accounts for 0.0% (addressed by drug efficacy). HIV testing: 6.9%. Architectural barriers: 93.1%. Within architecture, criminalization dominates at 38.4%, followed by infrastructure (21.9%) and stigma (20.6%).
Slide 10 — Policy Scenarios
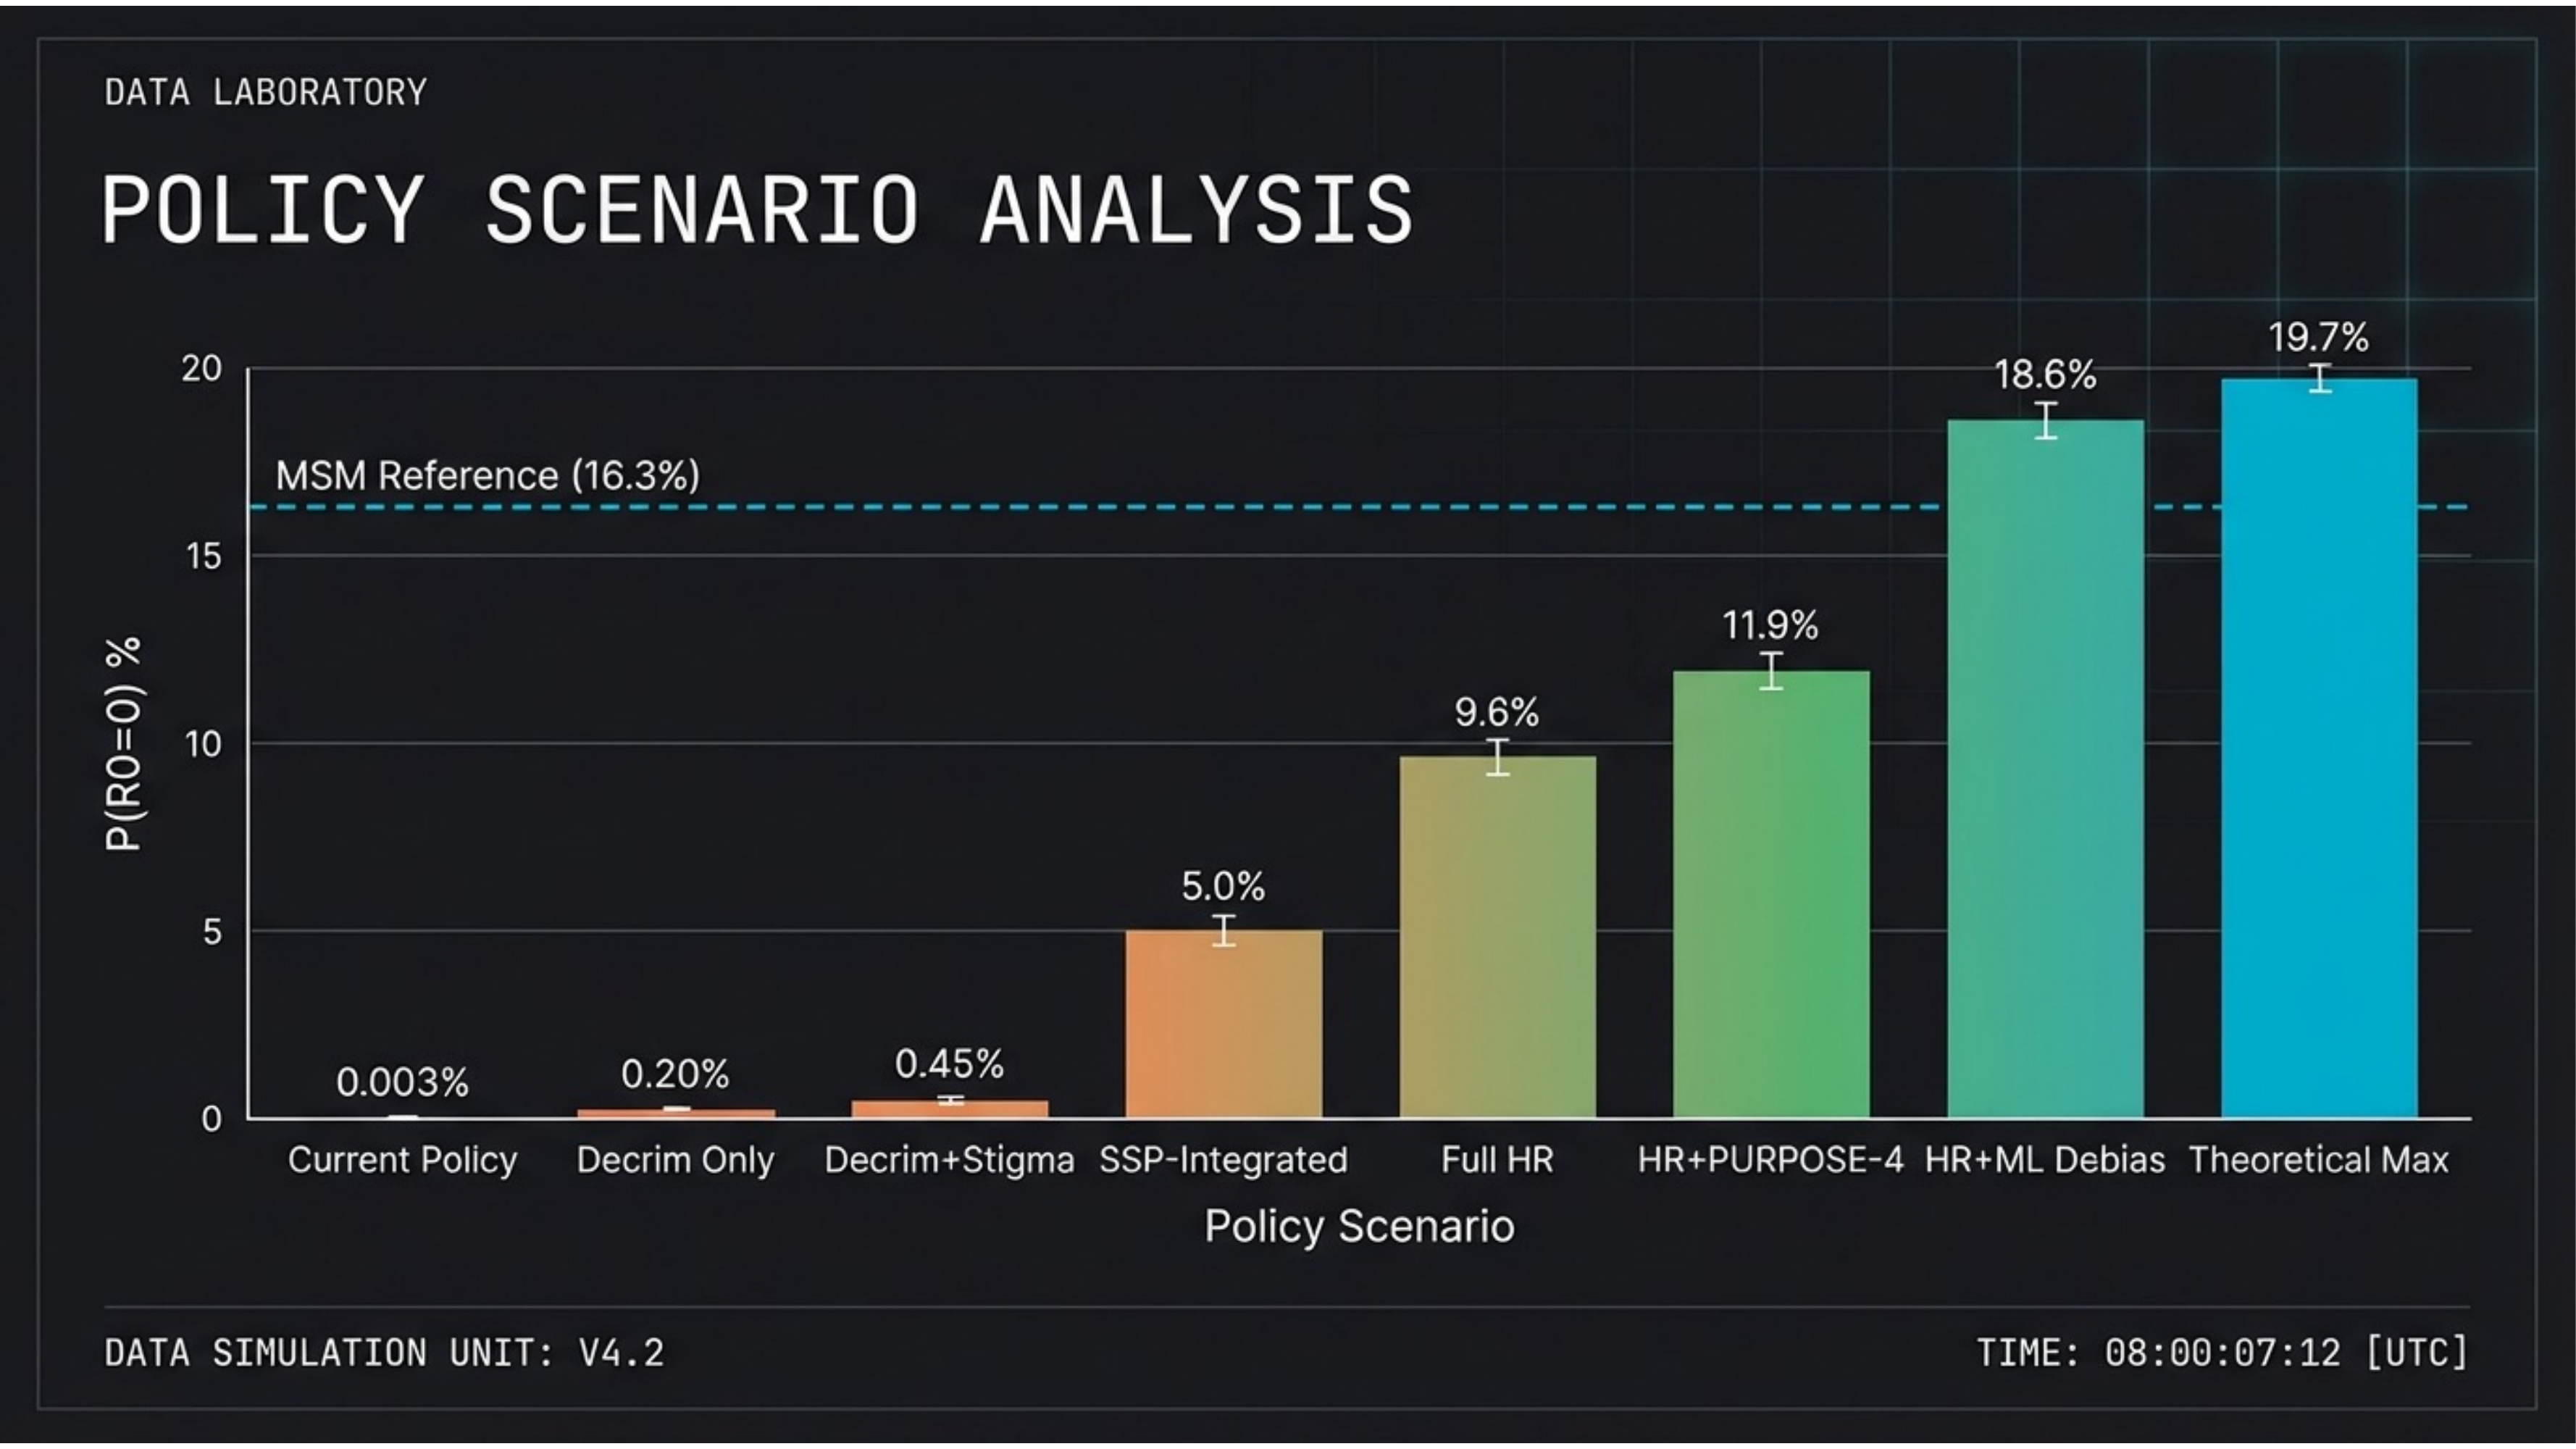
Policy reform is the mathematical prerequisite. Current policy: 0.003%. Decriminalization only: 0.20%. Full harm reduction: 9.6%. HR + ML debiasing: 18.6%. Theoretical max: 19.7%. Only comprehensive structural reform approaches the MSM reference (16.3%).
Slide 11 — Stochastic Avoidance
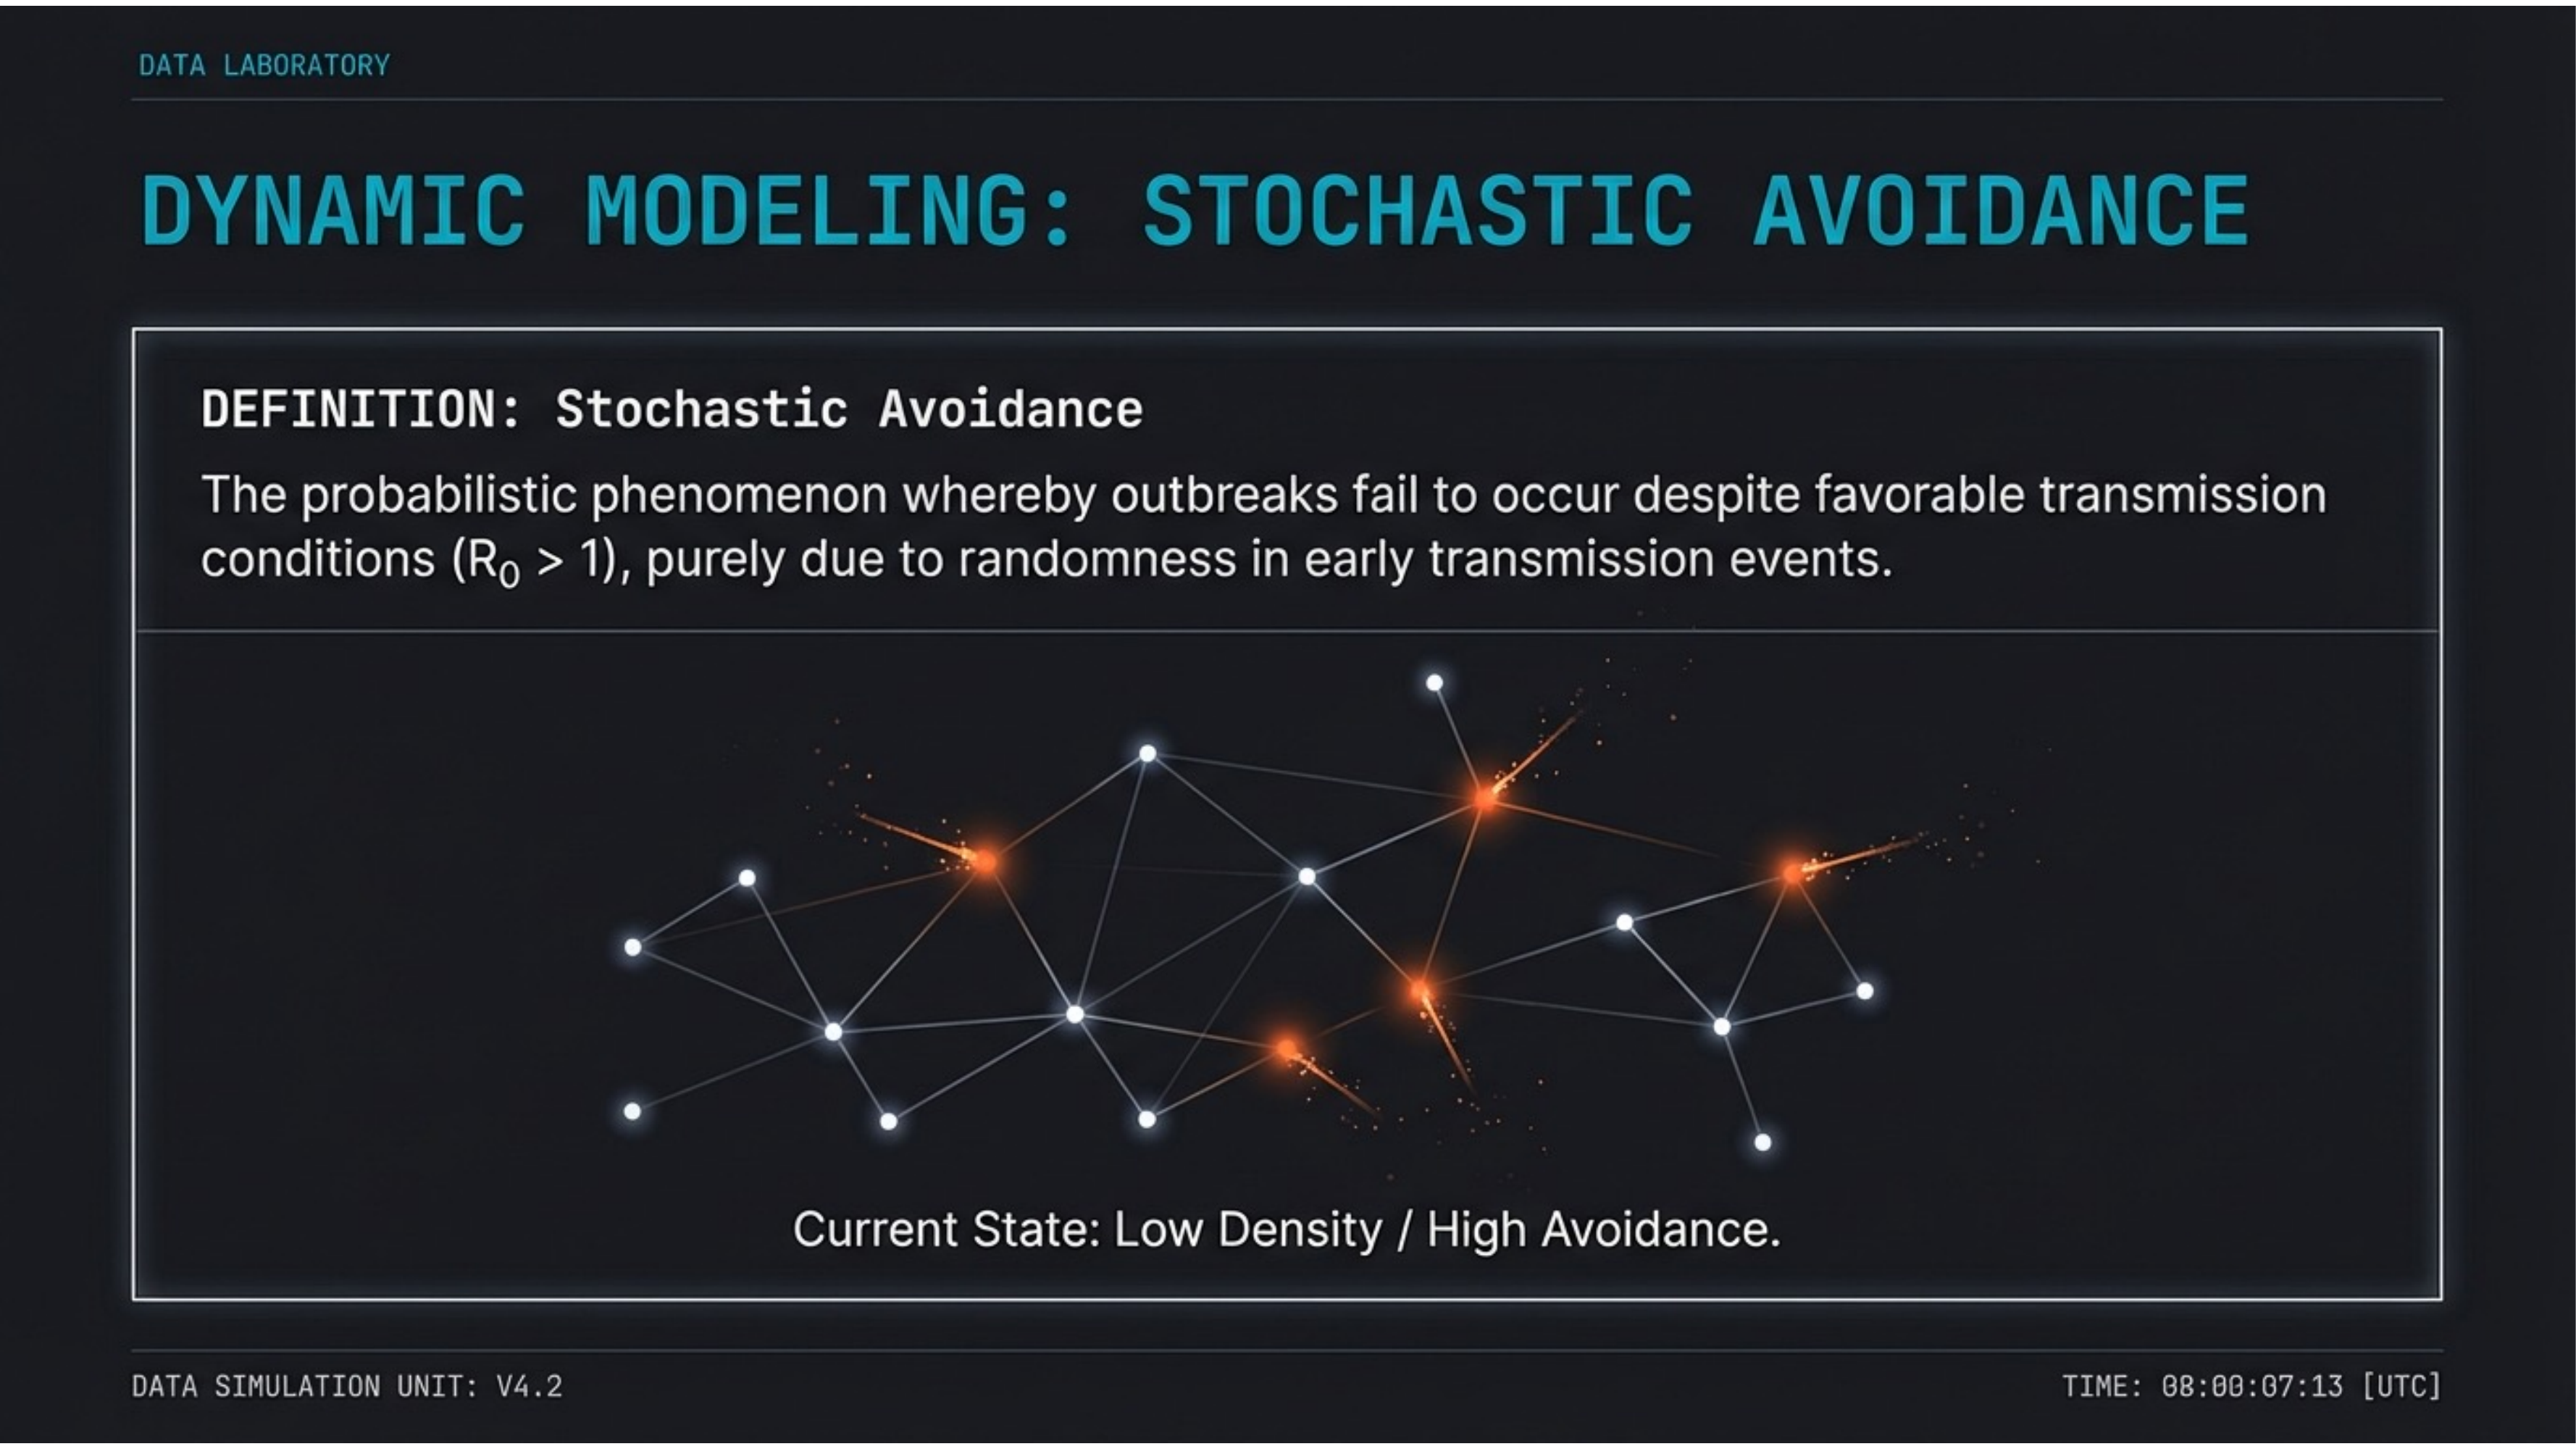
Why hasn’t the outbreak already happened? Stochastic avoidance: outbreaks fail to occur despite favorable transmission conditions (R0 > 1) purely due to randomness in early transmission events. Current state: low network density sustains high avoidance — but this is eroding.
Slide 12 — Network Density Equation
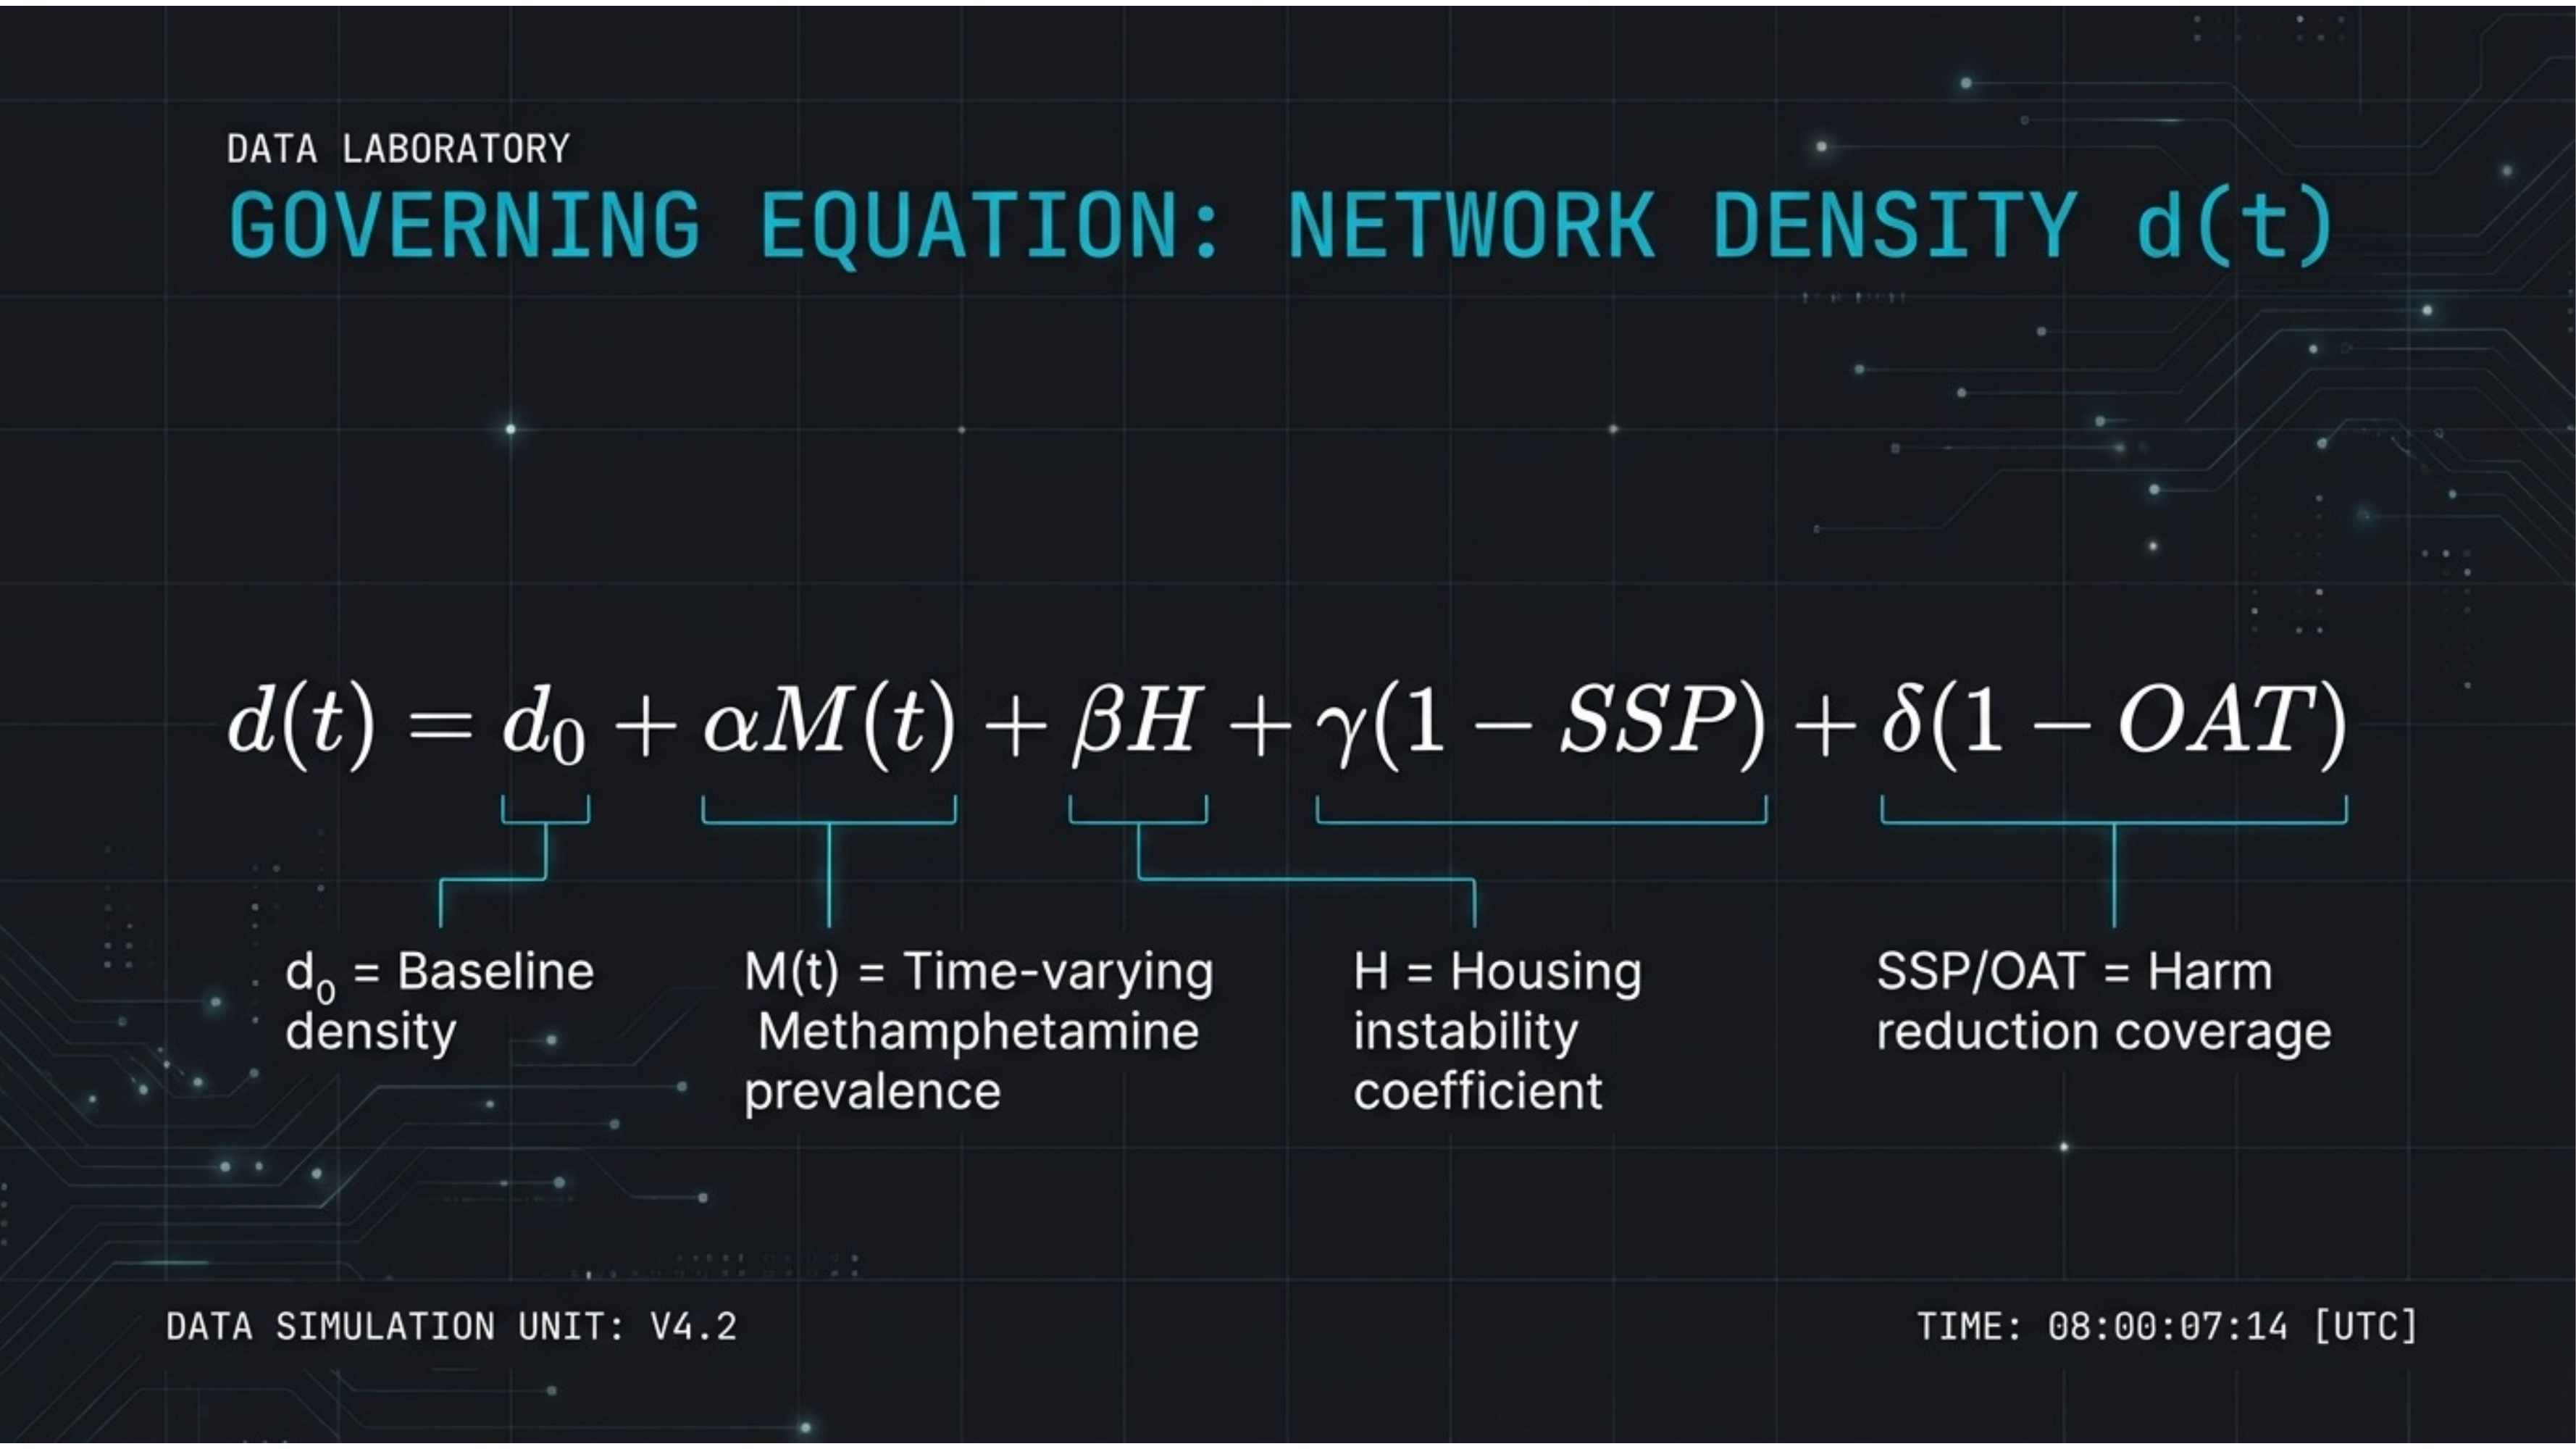
The governing equation for outbreak risk. d(t) = d0 + αM(t) + βH + γ(1–SSP) + δ(1–OAT). Methamphetamine prevalence, housing instability, and gaps in syringe services and opioid agonist therapy all drive network density toward the critical threshold.
Slide 13 — Baseline Forecast
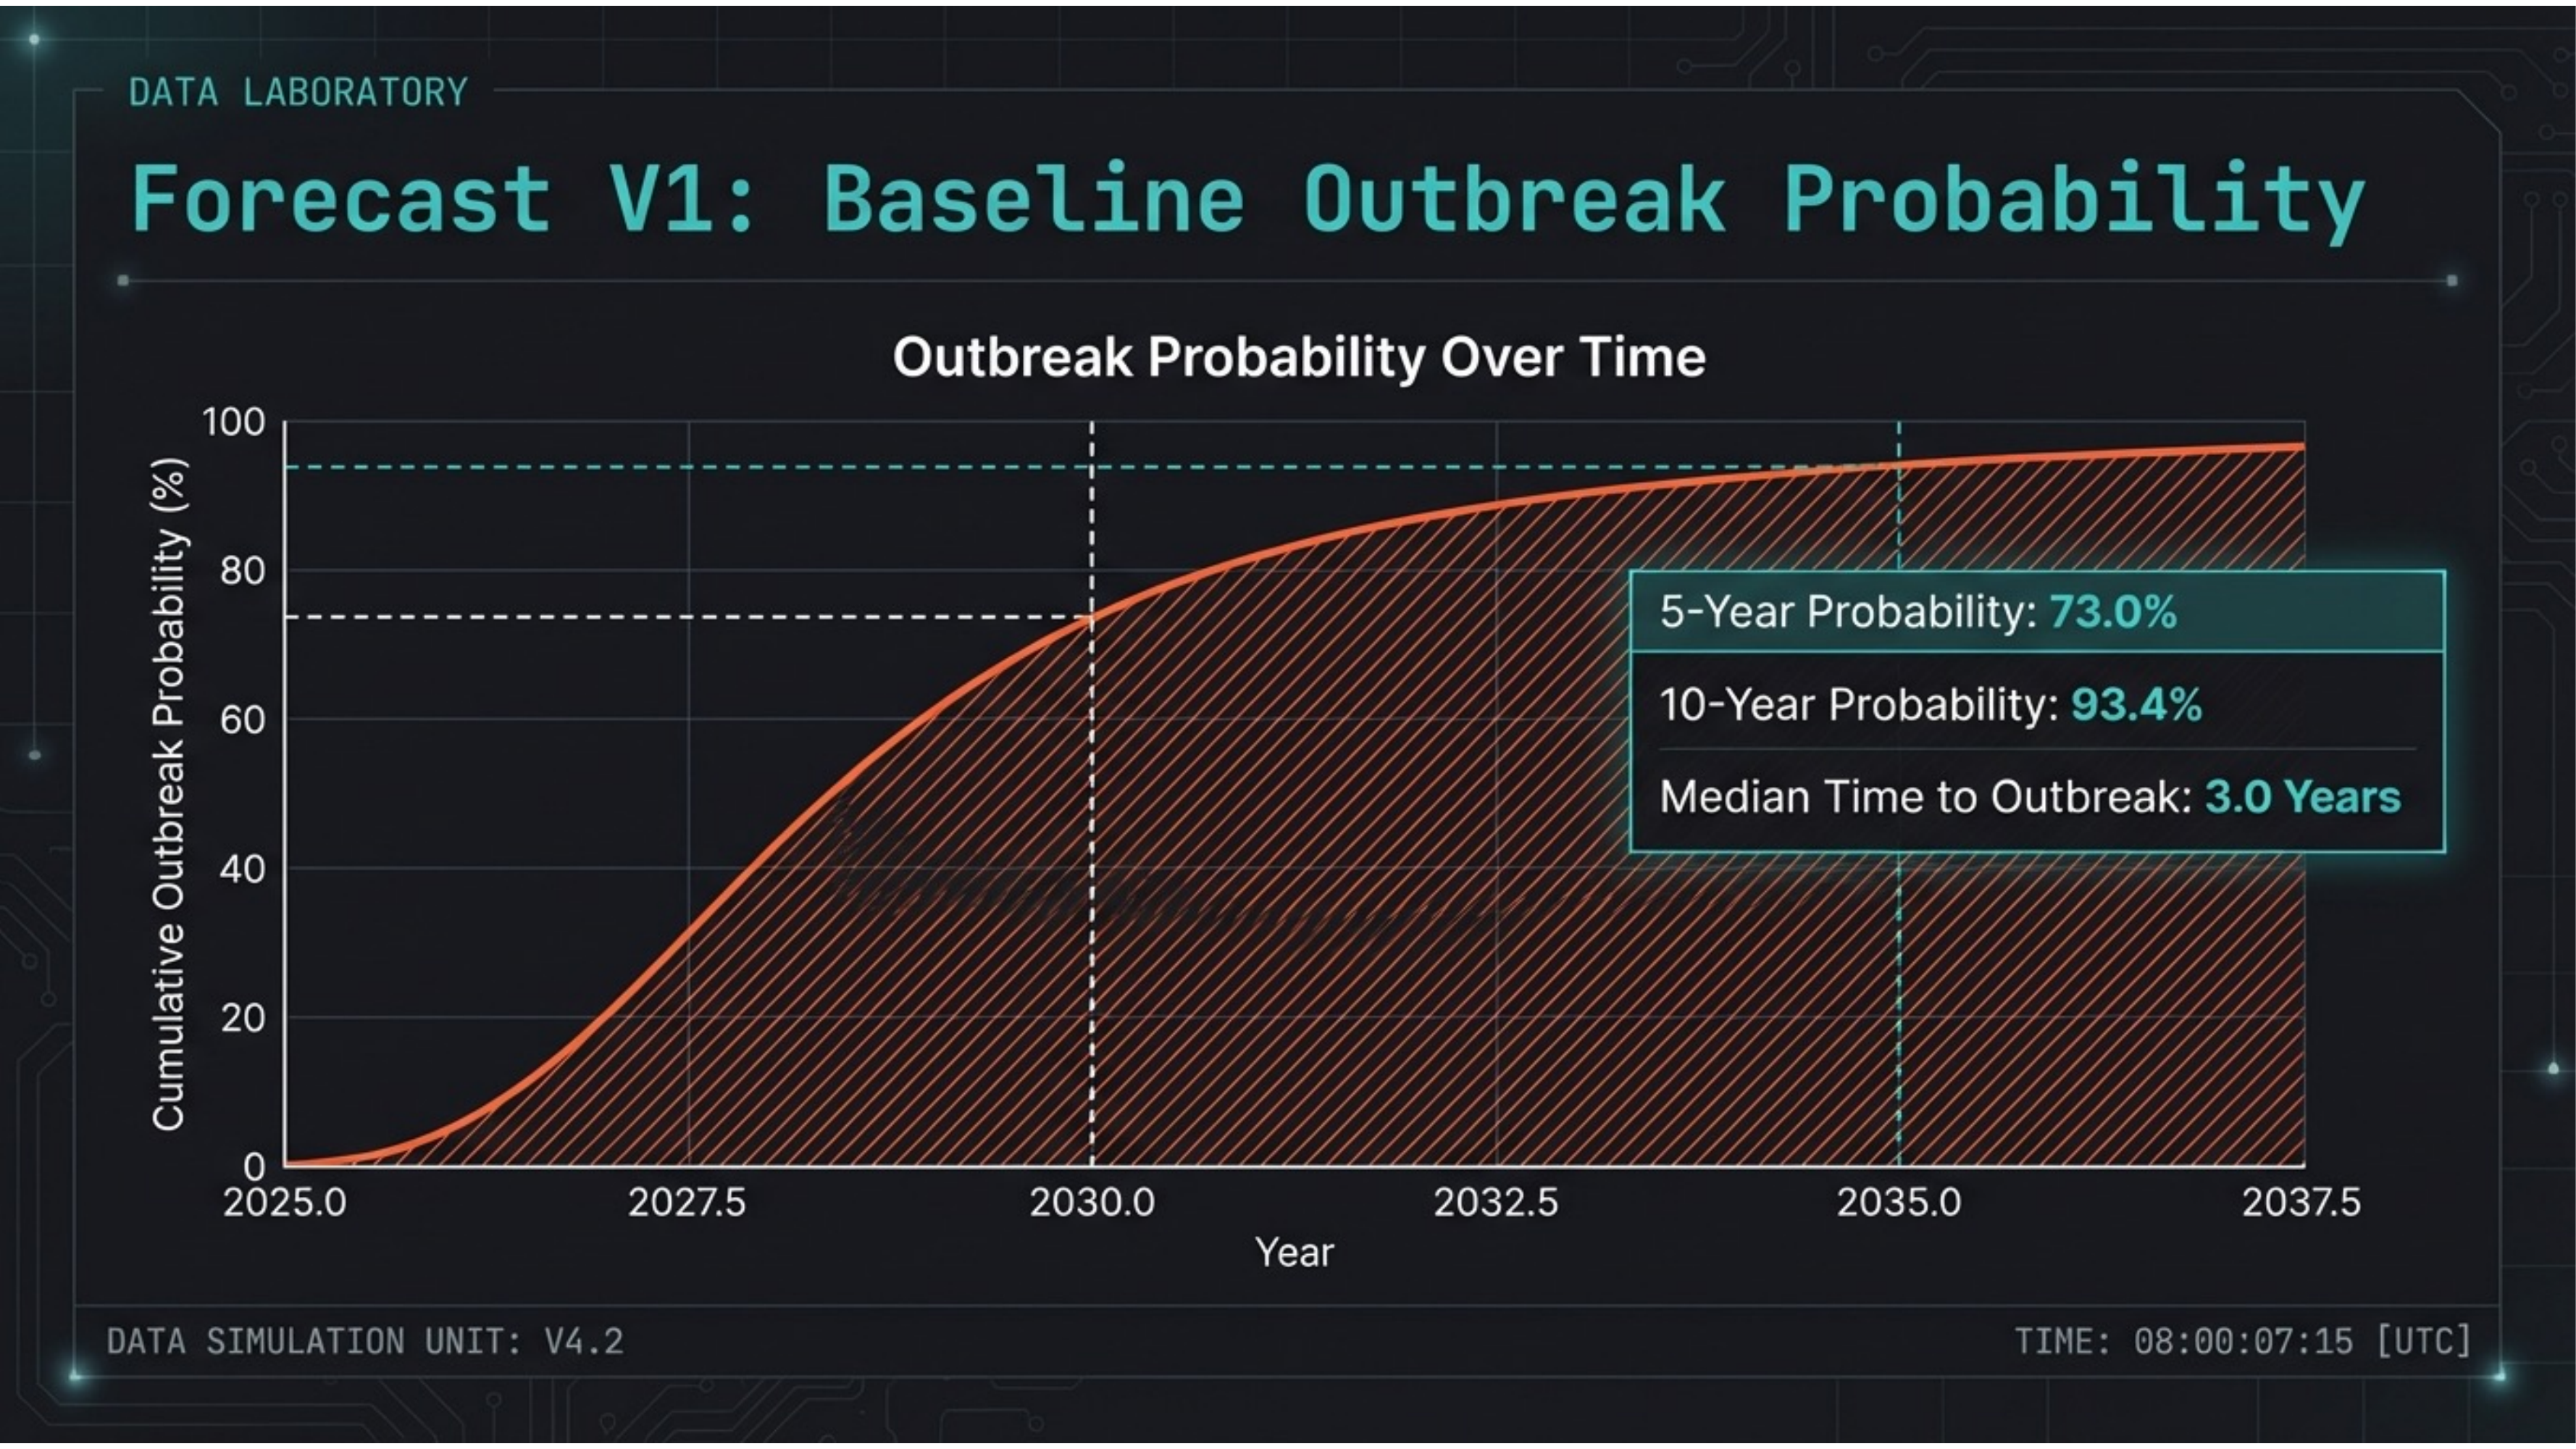
73% national outbreak probability within 5 years. The V1 additive model projects: 5-year probability 73.0%, 10-year probability 93.4%, median time to outbreak 3.0 years. The curve shows probability accumulating rapidly through the late 2020s.
Slide 14 — Sensitivity Analysis
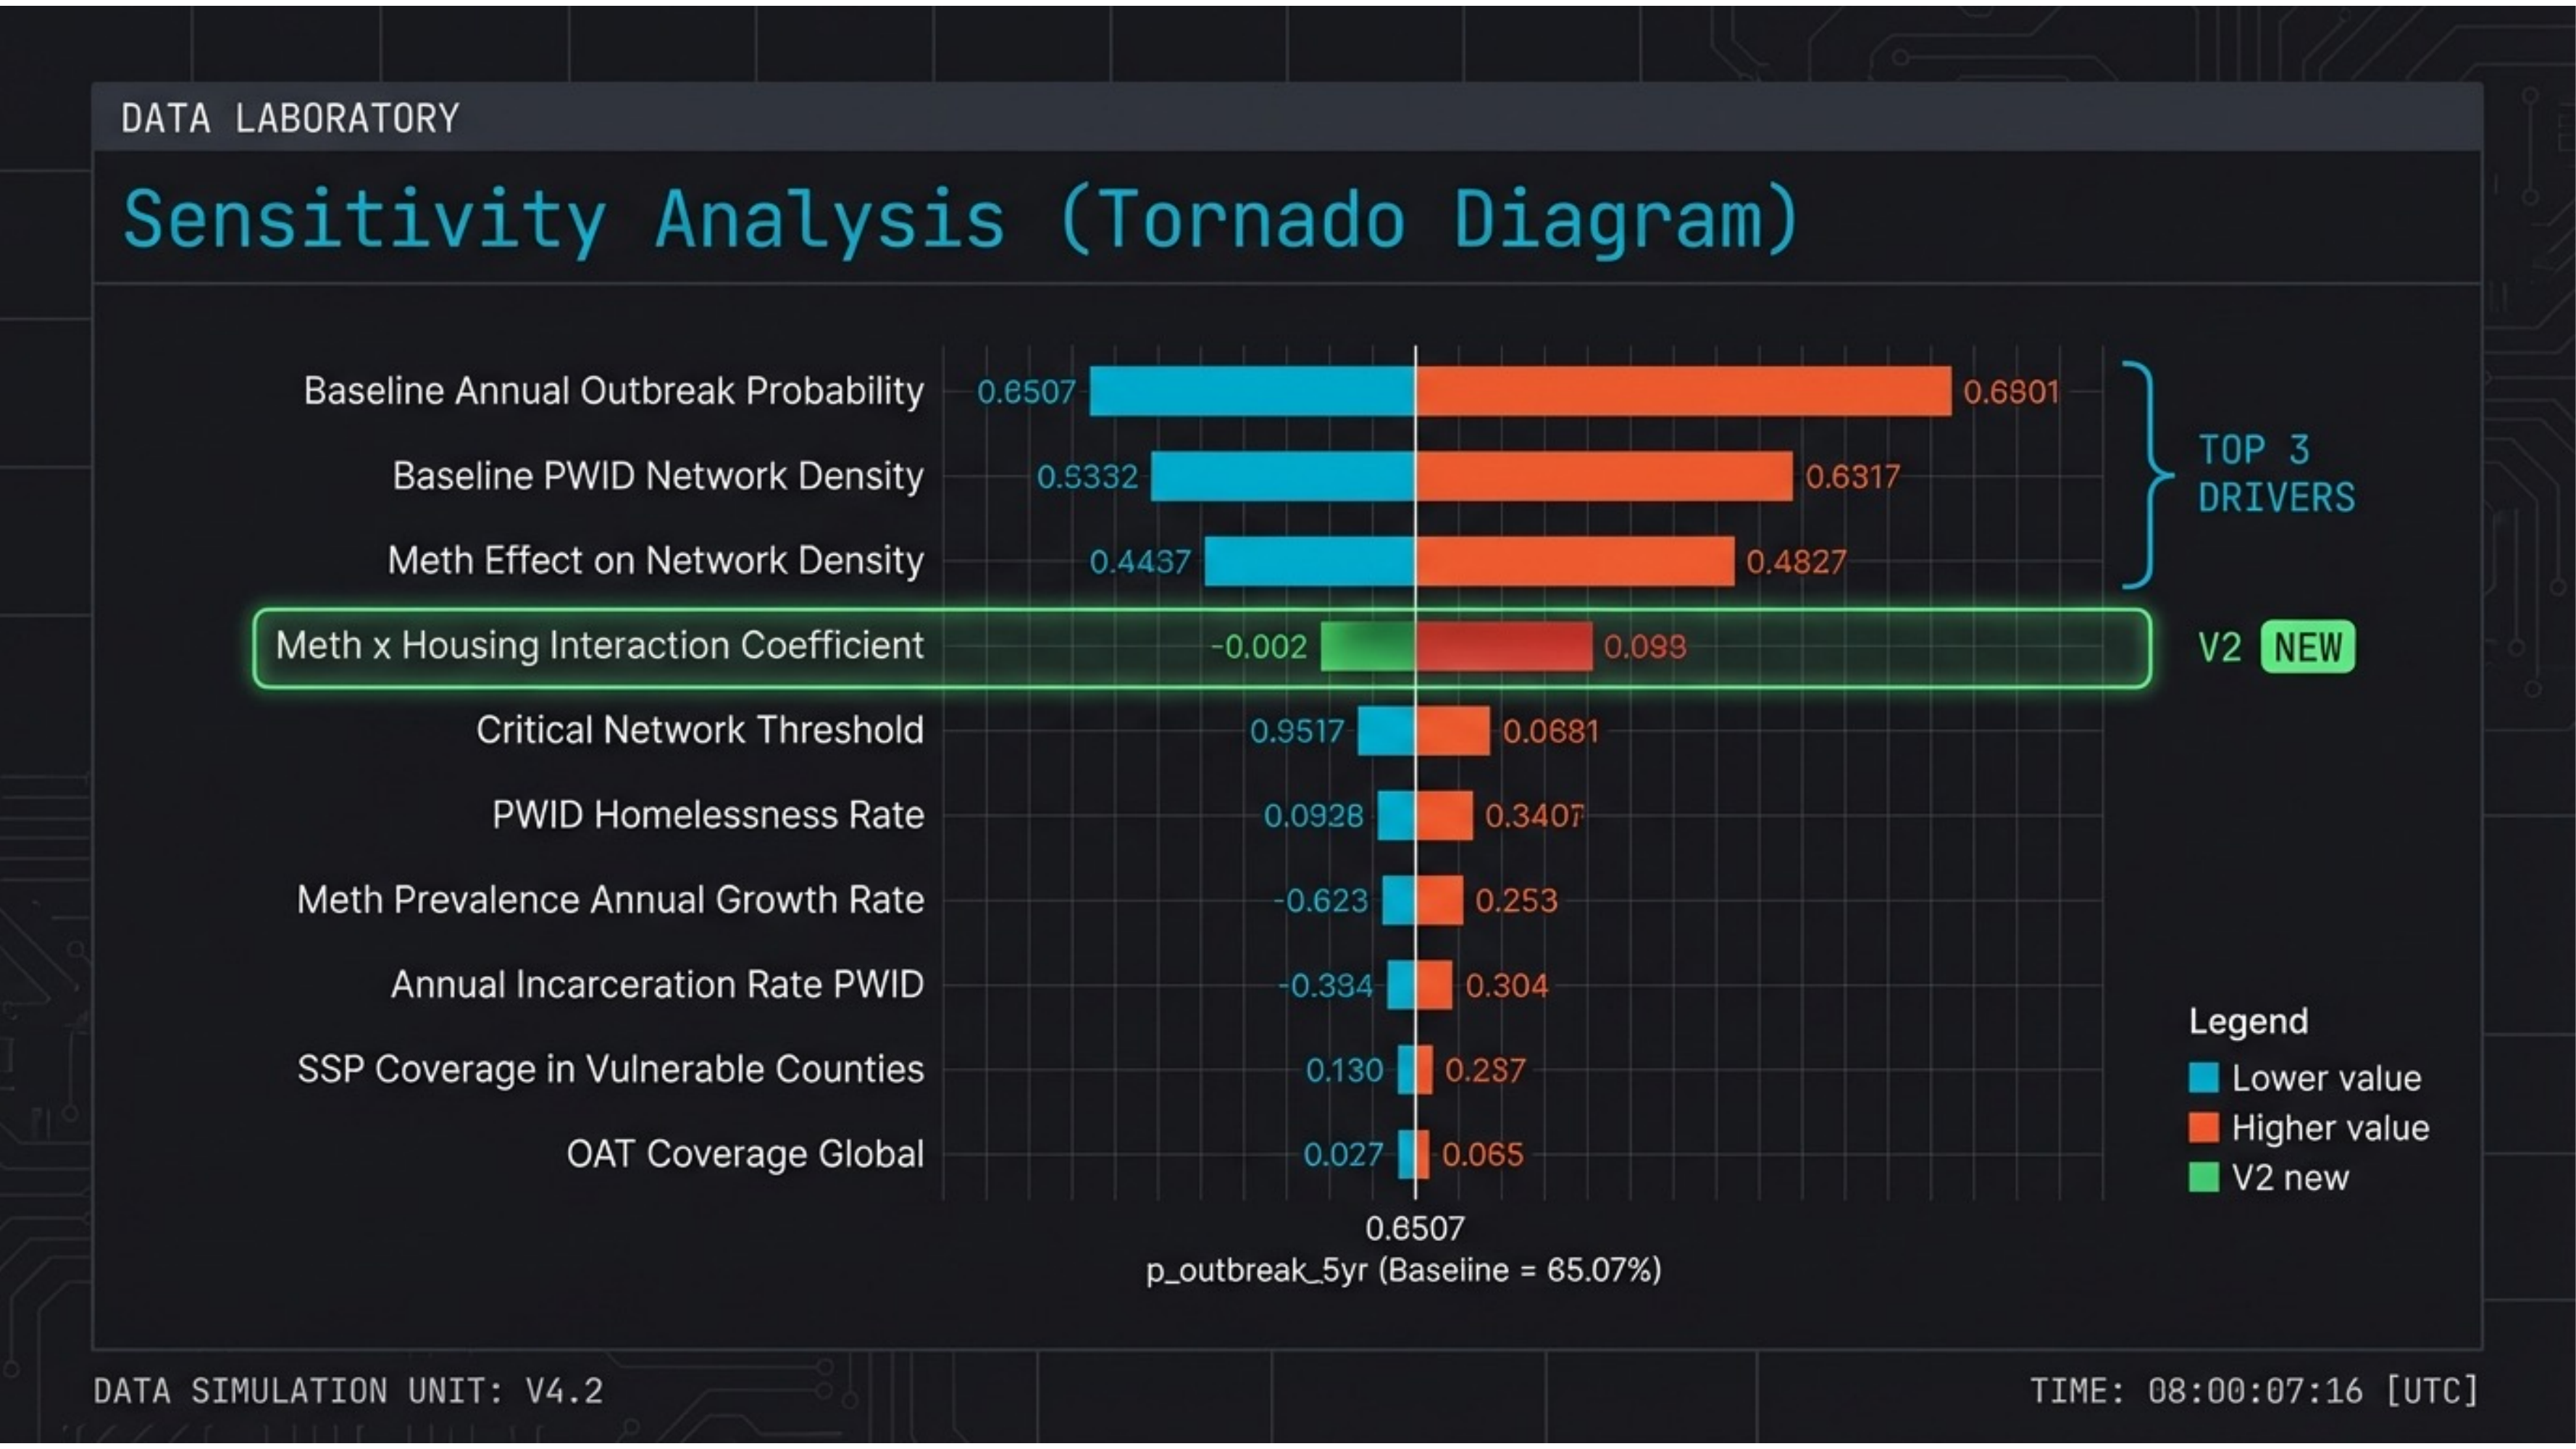
Three parameters dominate the forecast. Baseline annual outbreak probability, baseline PWID network density, and meth effect on network density are the top drivers. The V2 multiplicative model adds a meth × housing interaction coefficient as a new structural term.
Slide 15 — Model Refinement
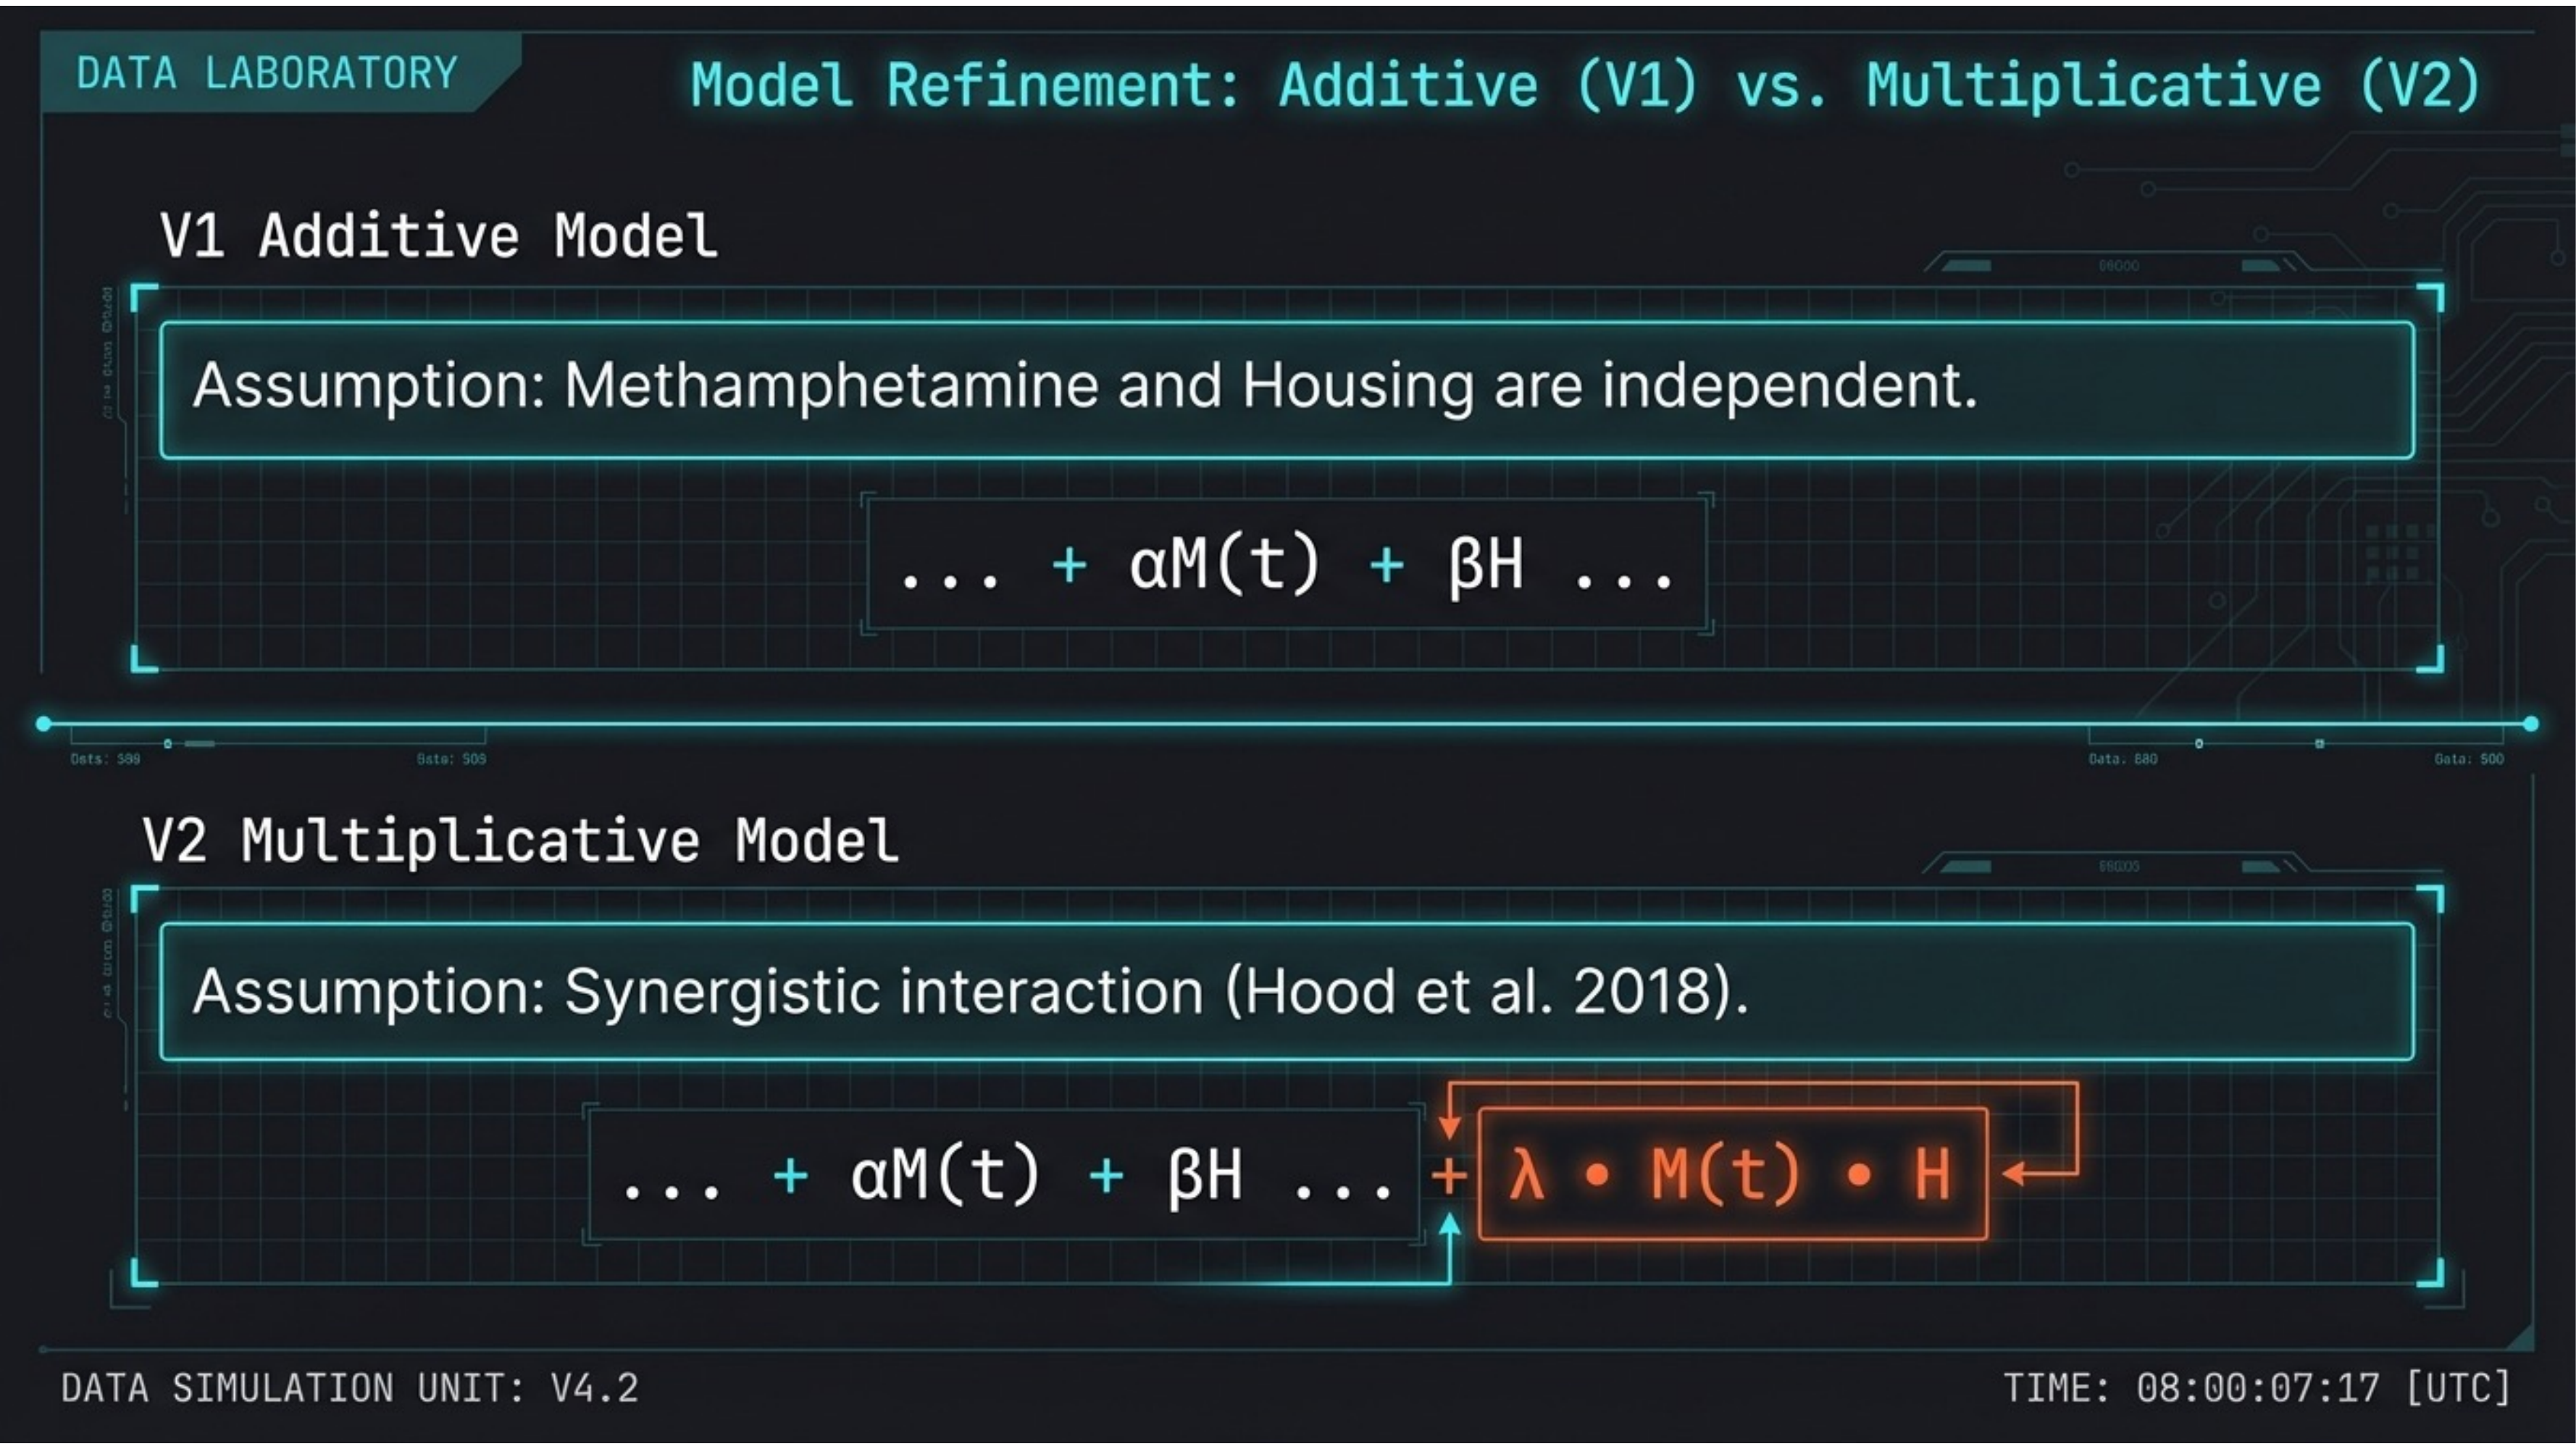
From additive to multiplicative: capturing synergistic vulnerability. V1 assumes methamphetamine and housing are independent. V2 adds an interaction term λ · M(t) · H based on Hood et al. (2018), capturing the synergistic effect where co-occurring risks exceed the sum of parts.
Slide 16 — Interaction Coefficient
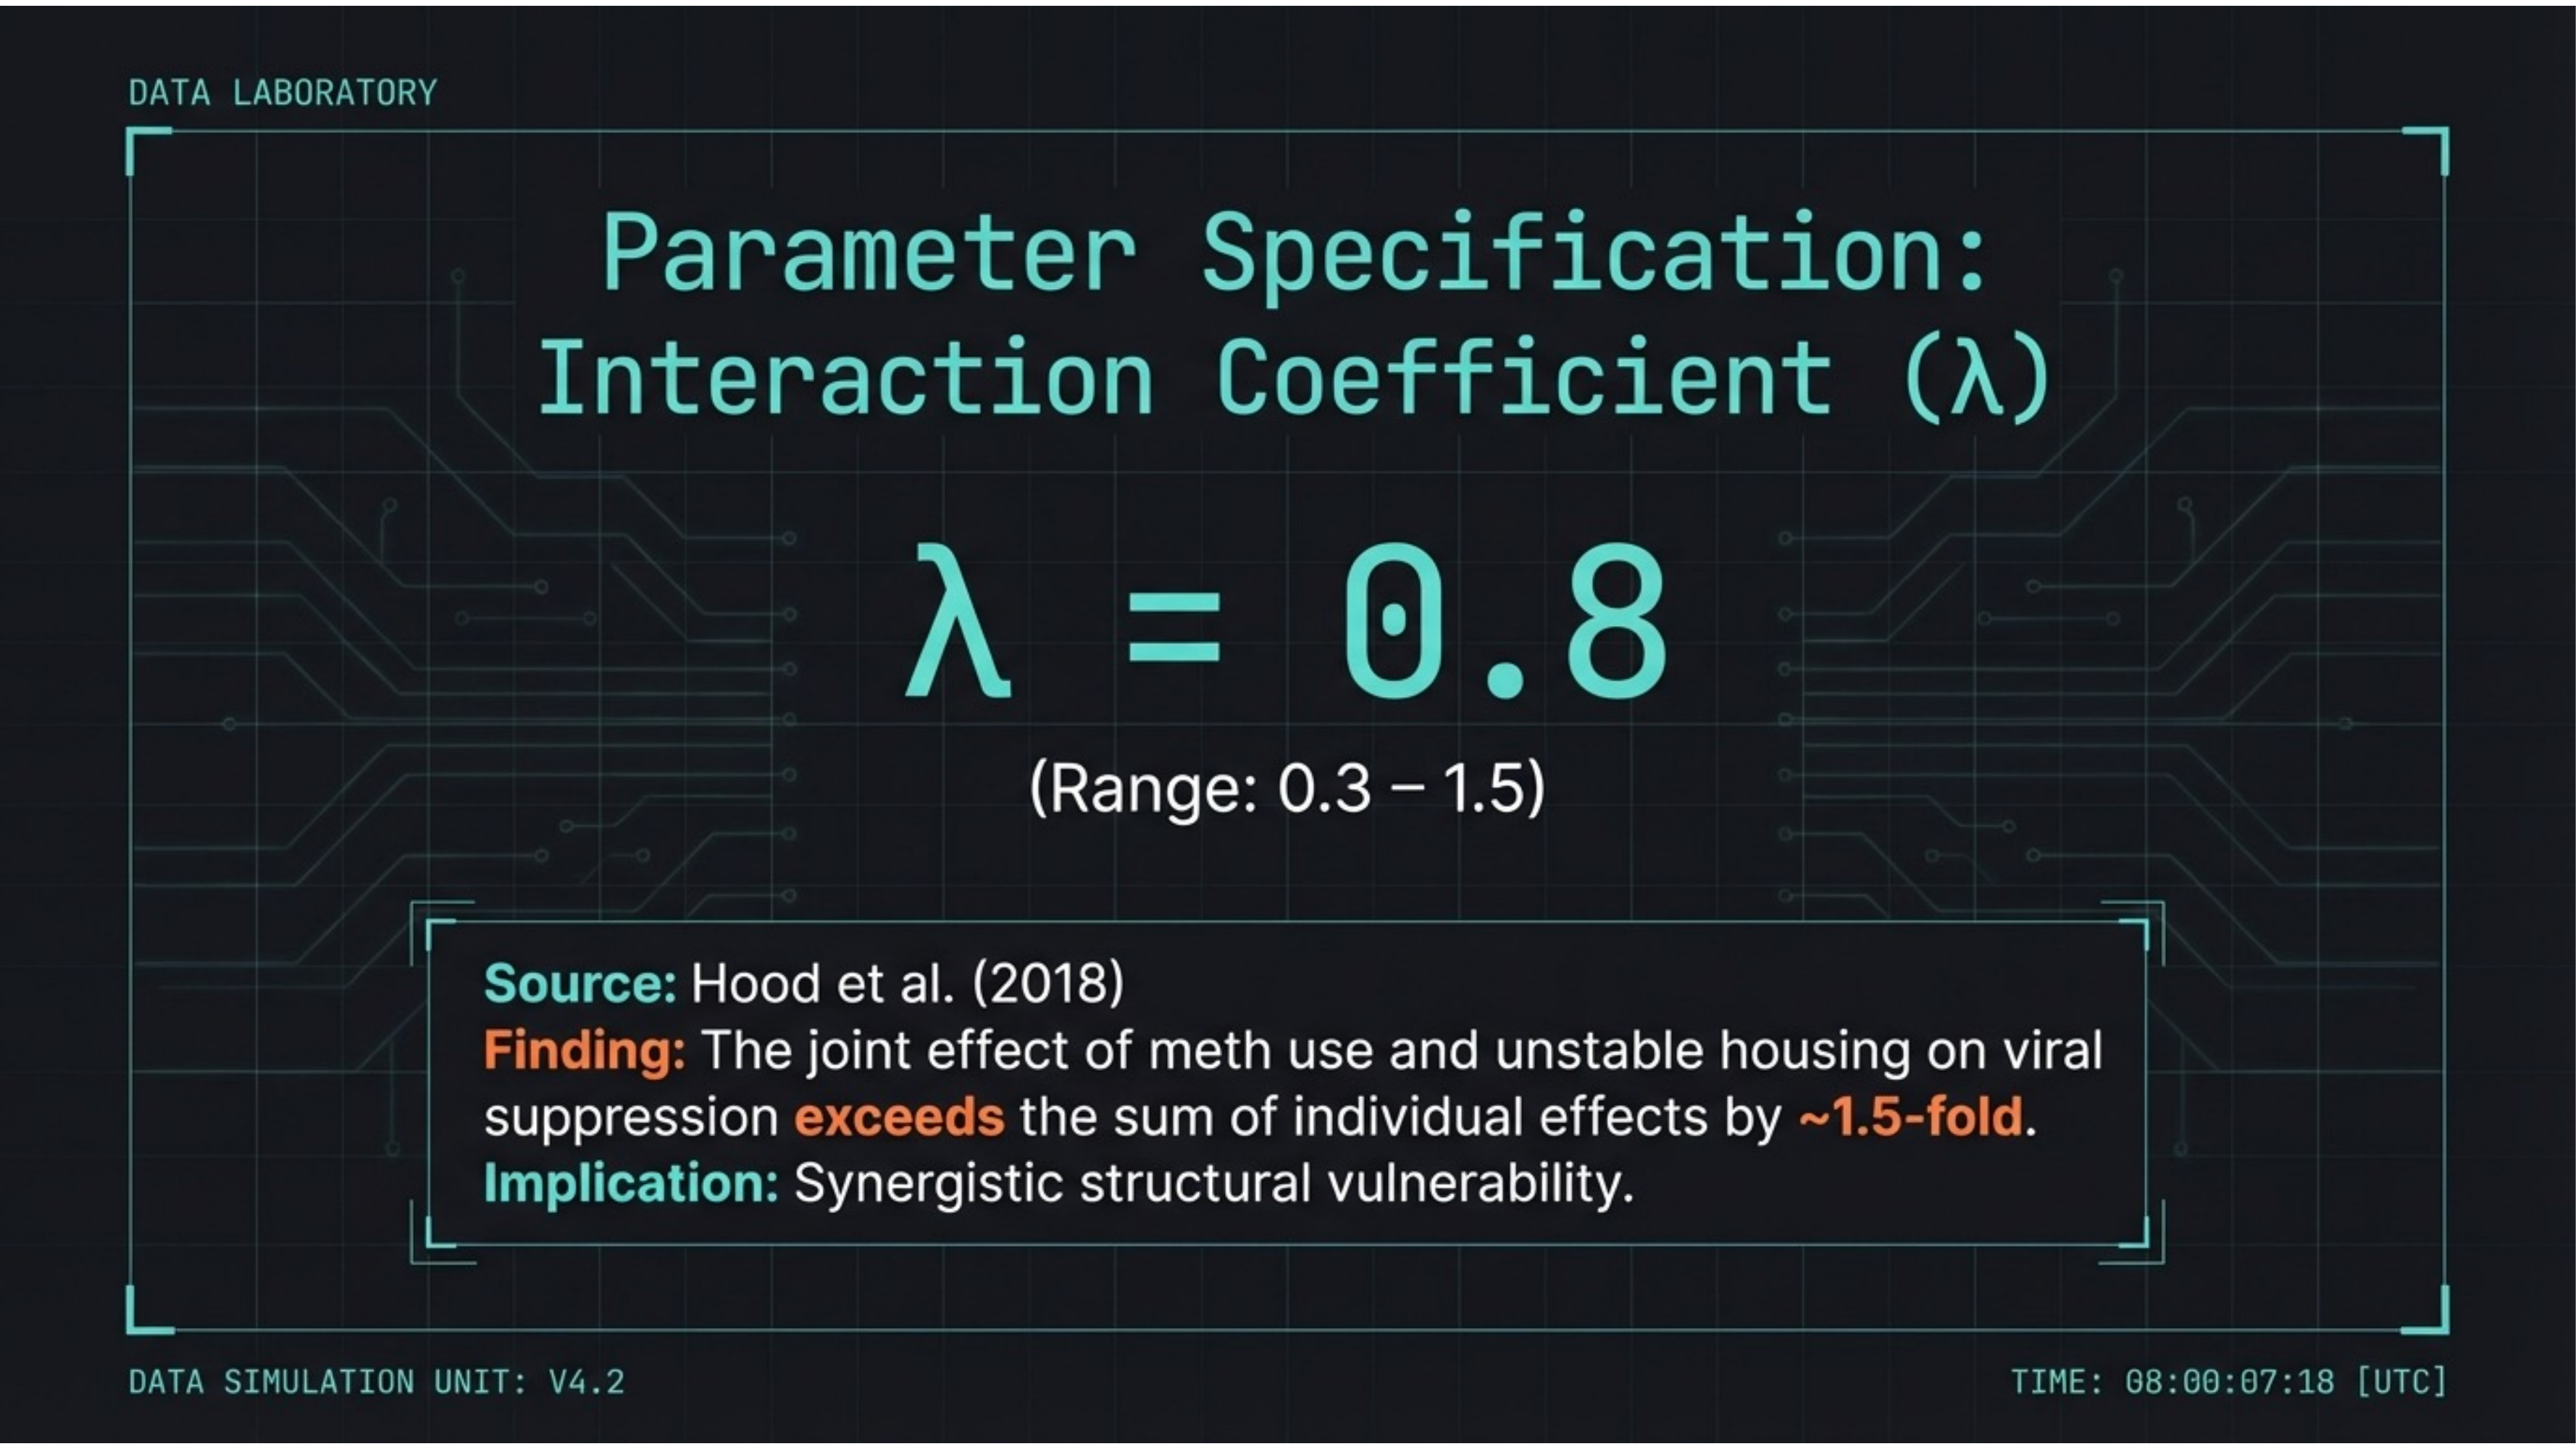
The joint effect exceeds the sum by ~1.5-fold. Interaction coefficient λ = 0.8 (range 0.3–1.5), derived from Hood et al. (2018). The joint effect of methamphetamine use and unstable housing on viral suppression exceeds the sum of individual effects — synergistic structural vulnerability.
Slide 17 — Comparative Forecast
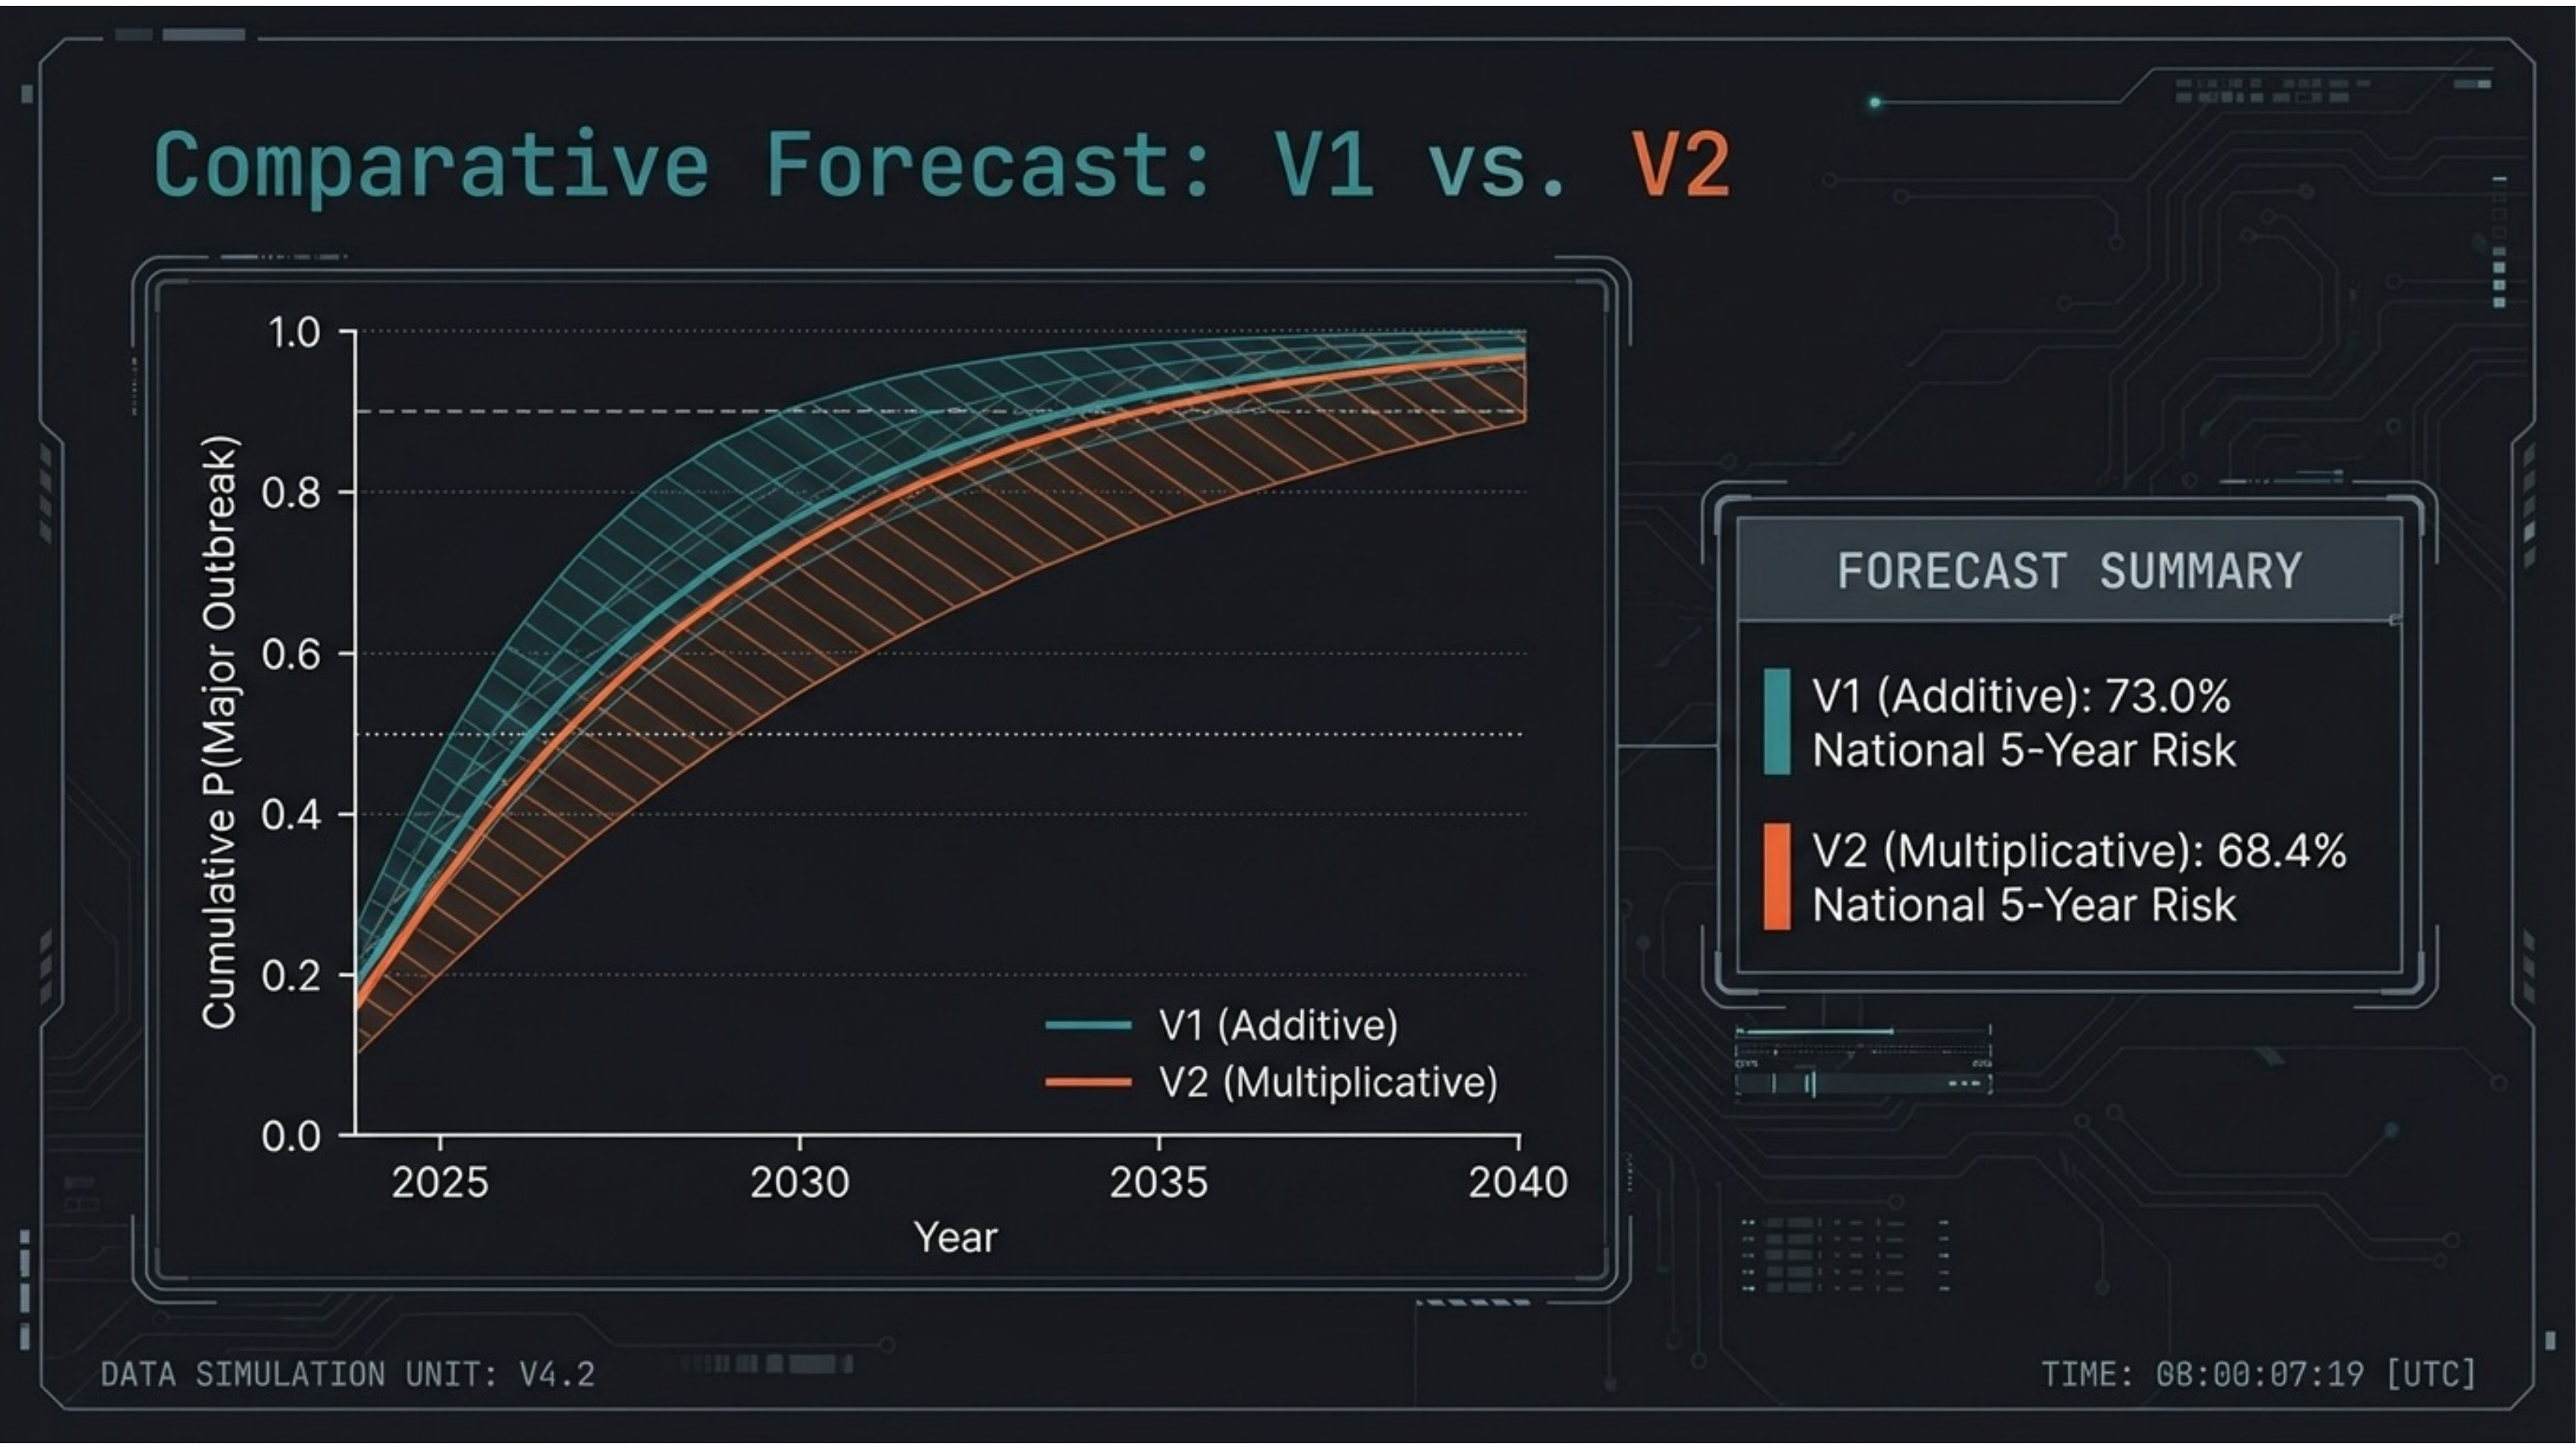
Both models converge on catastrophic risk. V1 (additive): 73.0% national 5-year risk. V2 (multiplicative): 68.4%. The slight decrease nationally masks a critical redistribution of risk toward vulnerable regions where interaction effects concentrate.
Slide 18 — Regional Collapse
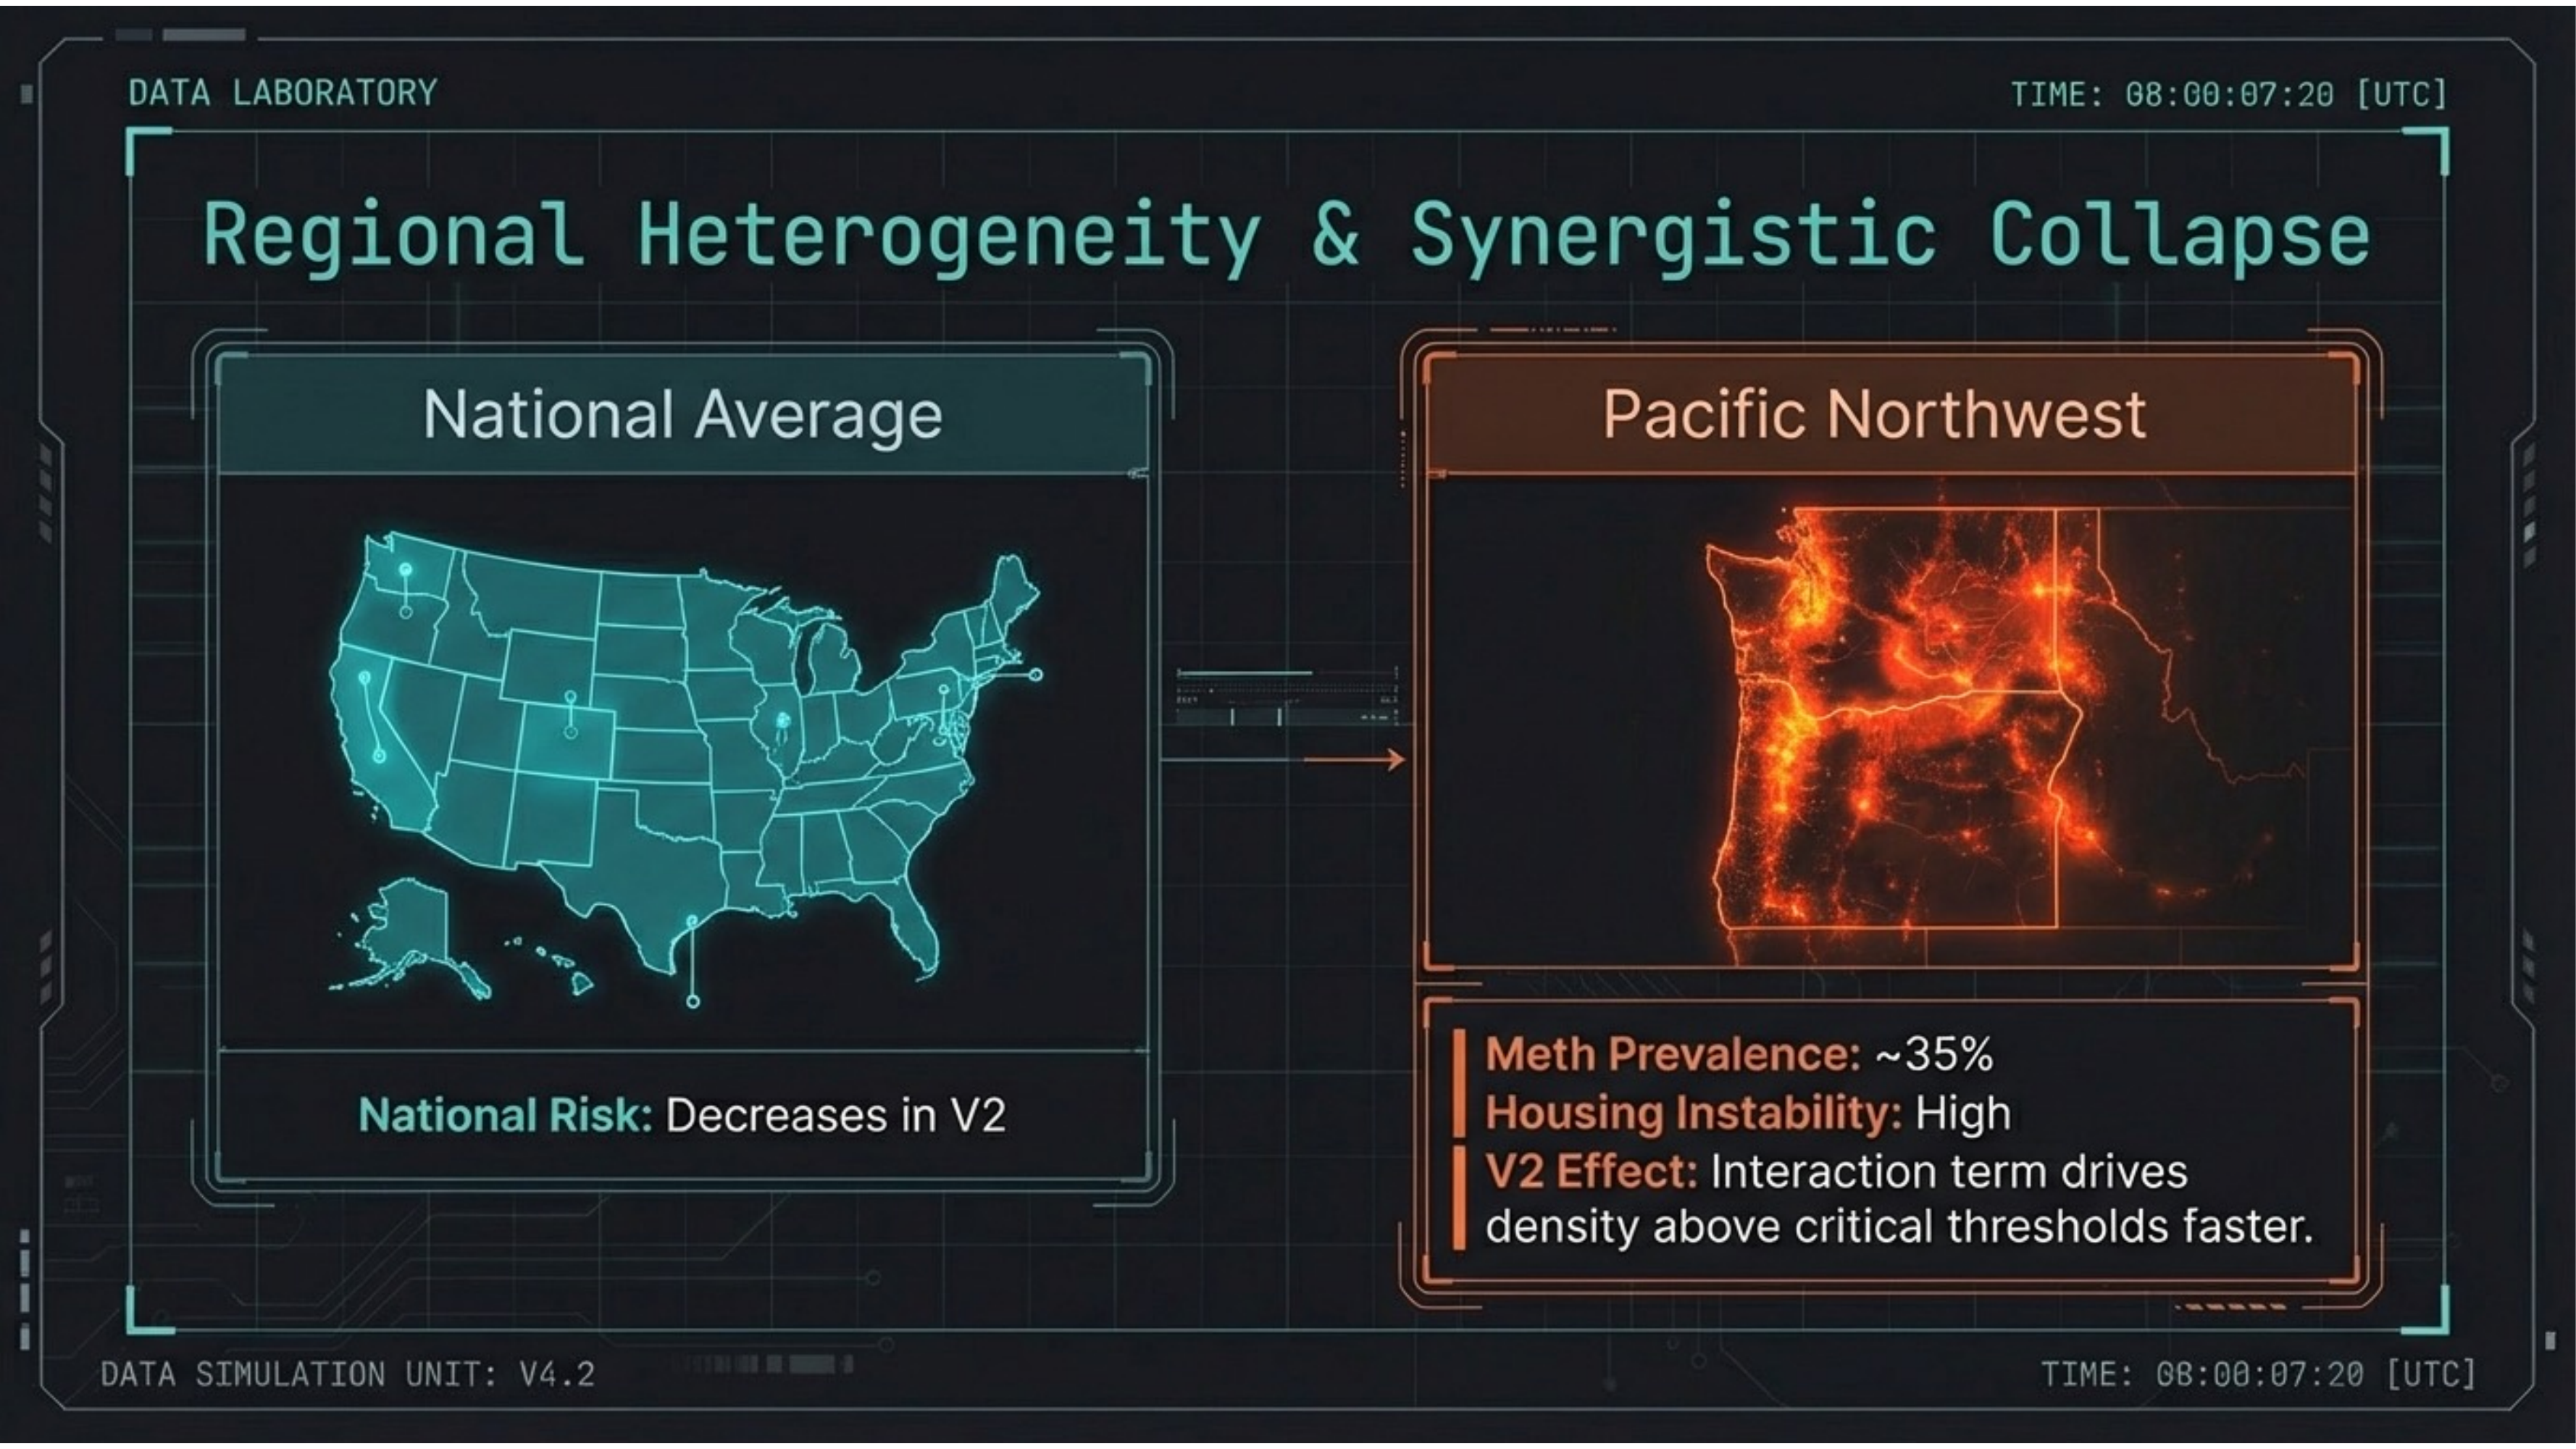
The Pacific Northwest faces acute synergistic collapse. While national risk slightly decreases in V2, the interaction term drives density above critical thresholds faster in regions with co-occurring meth prevalence (~35%) and high housing instability. Risk concentrates, it doesn’t disappear.
Slide 19 — Regional Forecast Data
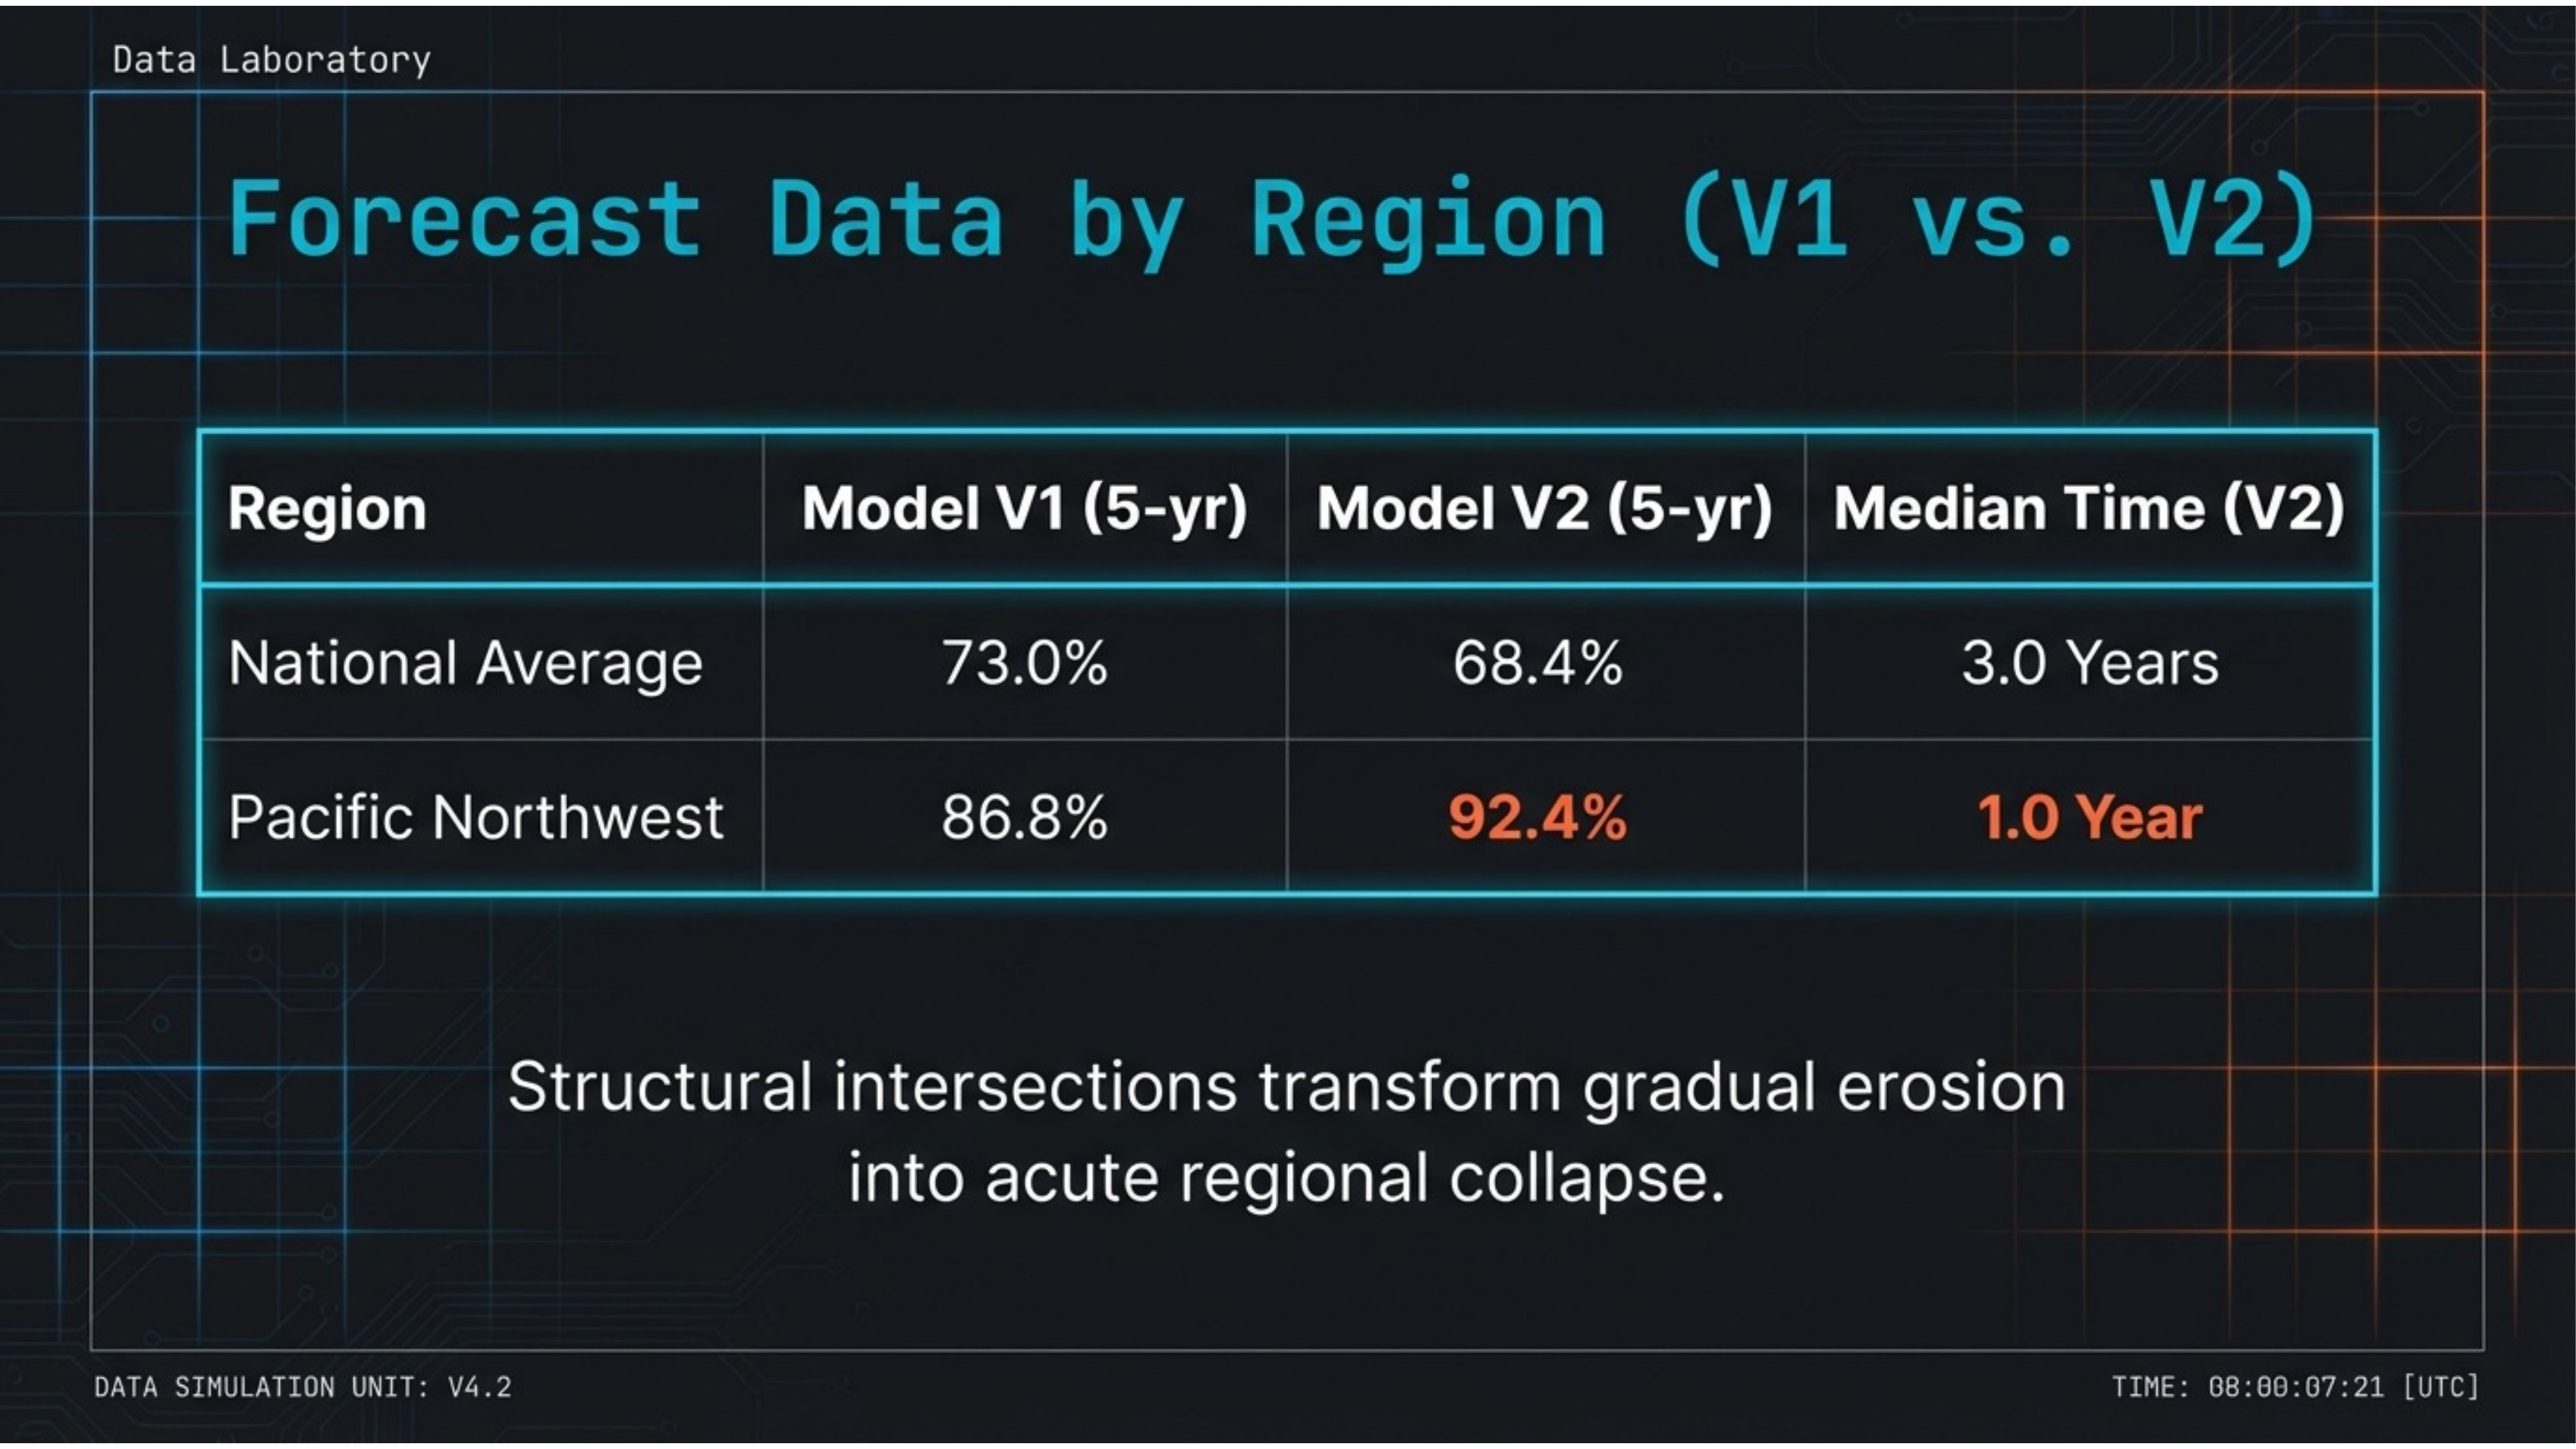
Structural intersections transform gradual erosion into acute regional collapse. National average (V2): 68.4% 5-year risk, median 3.0 years. Pacific Northwest: 92.4% 5-year risk, median 1.0 year to outbreak. The interaction term compresses the timeline dramatically.
Slide 20 — Evidence & Validation
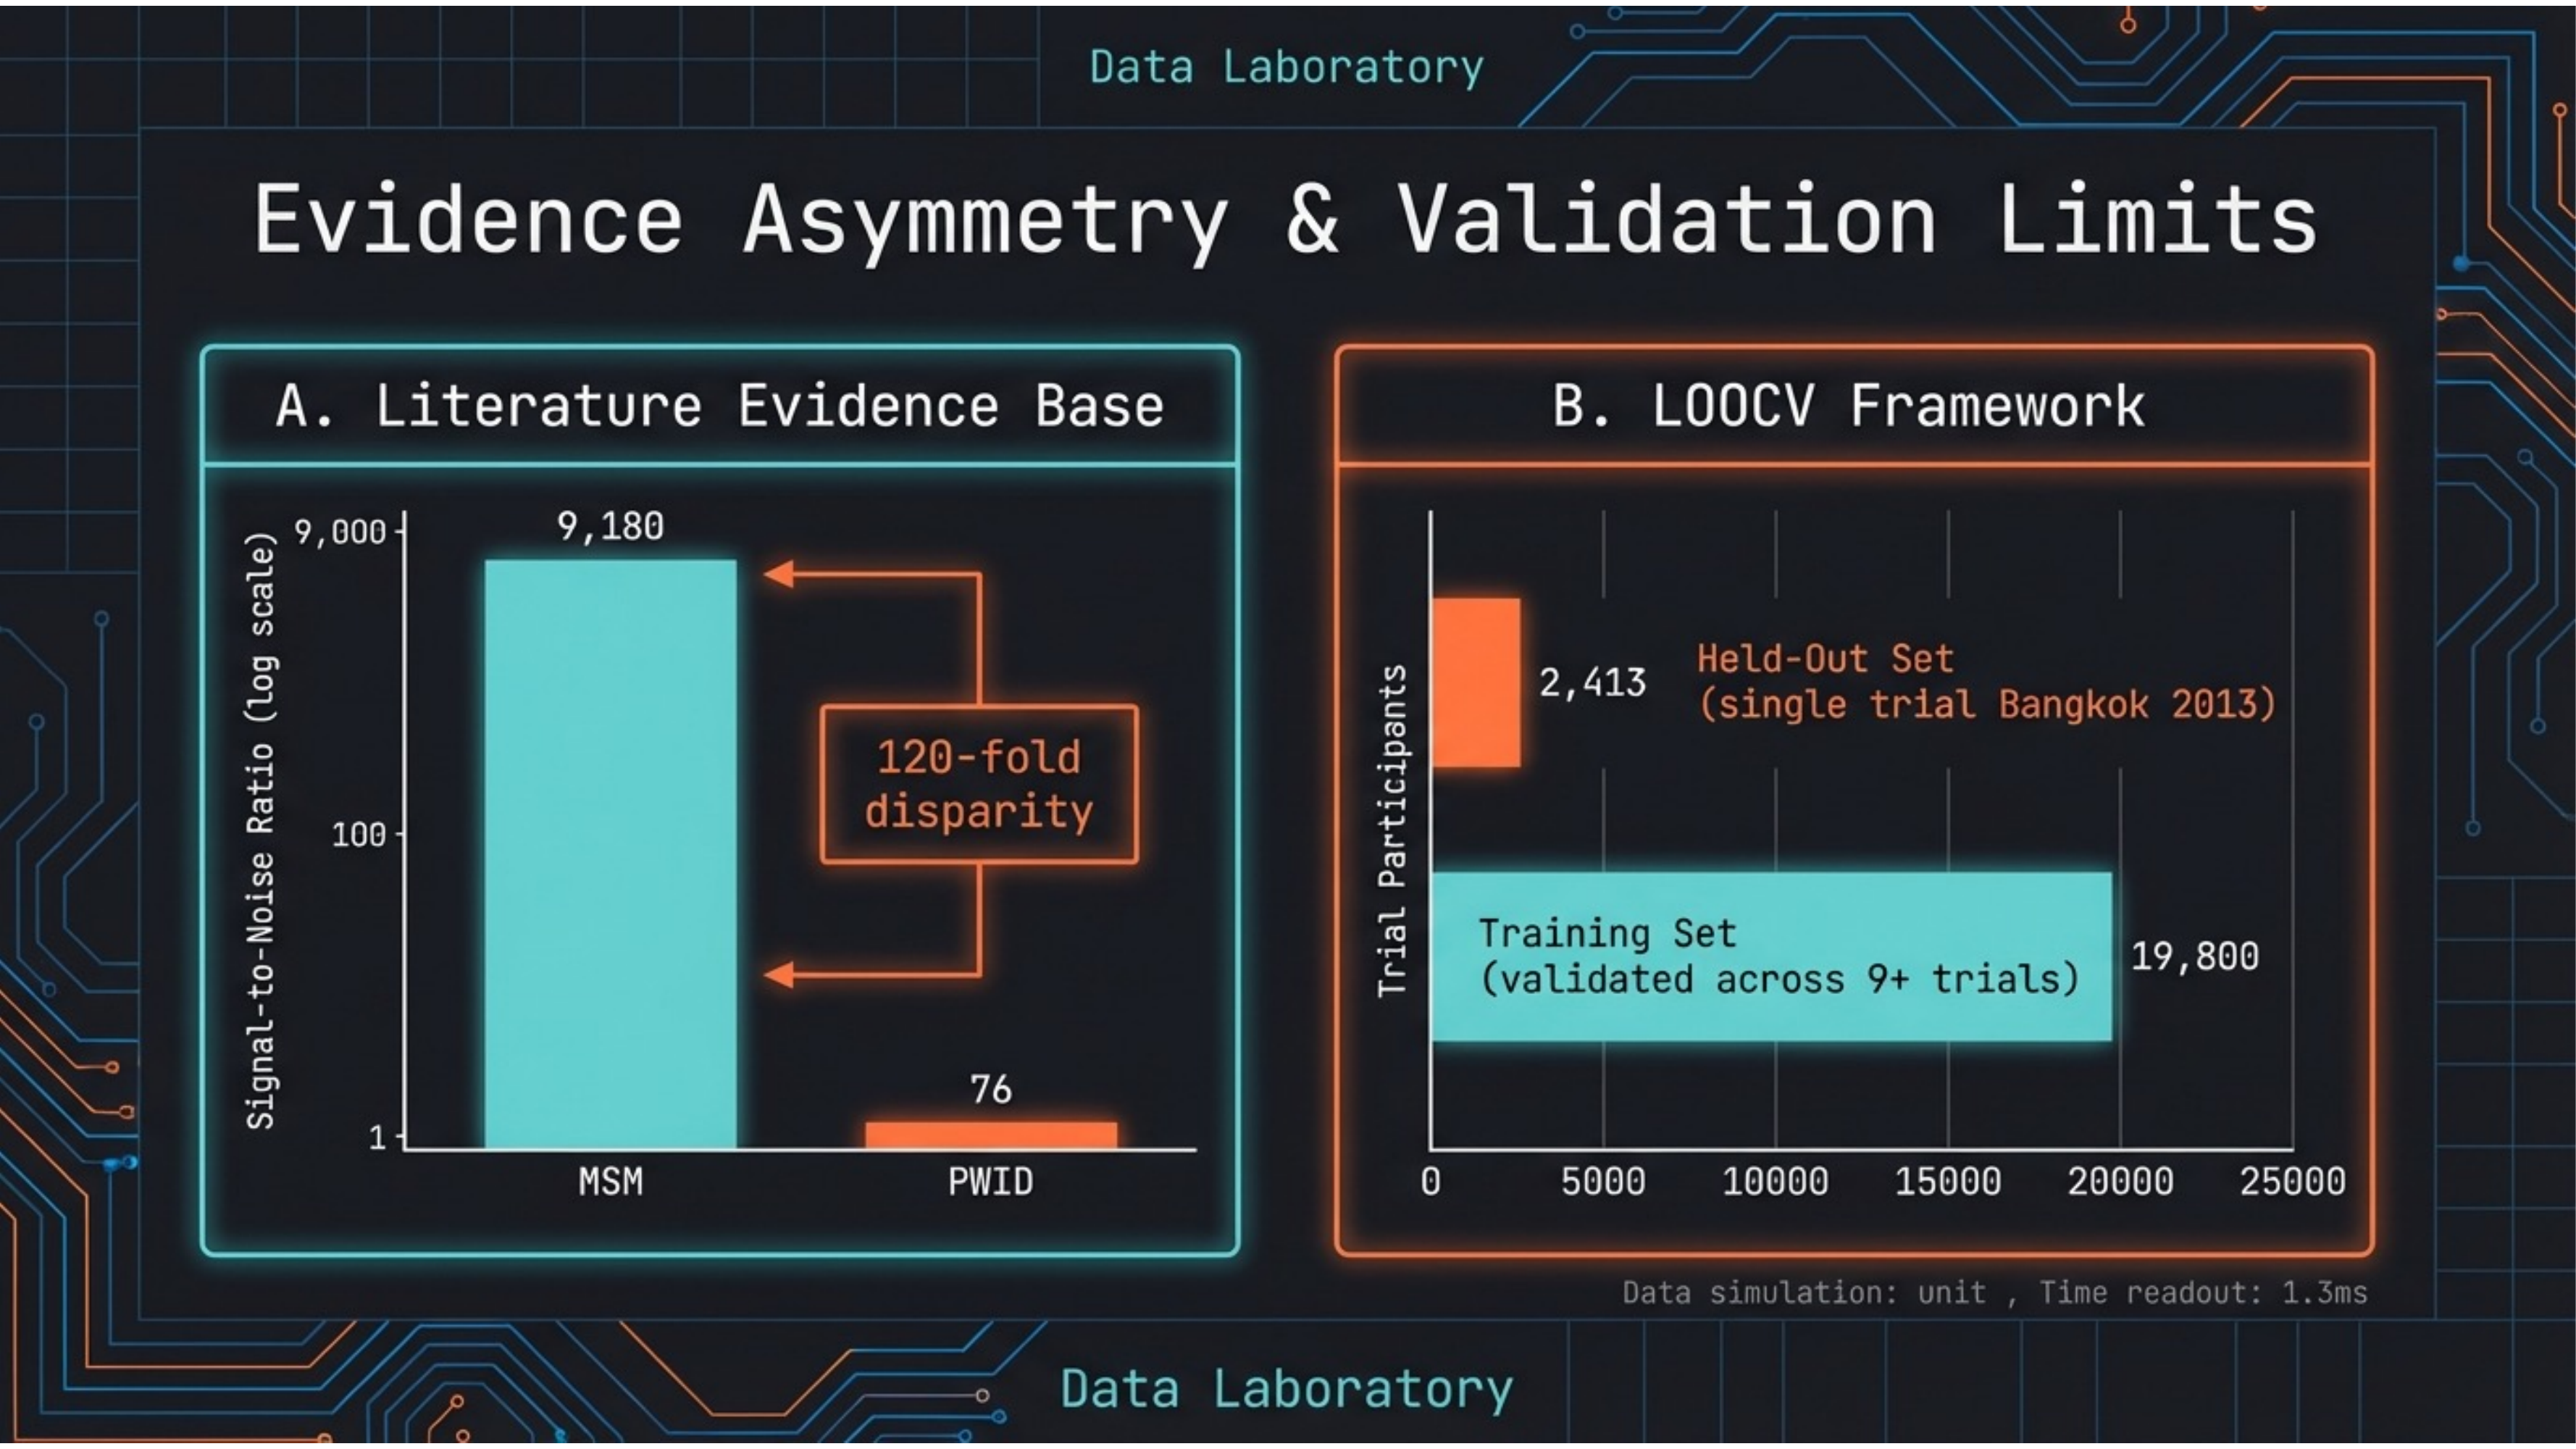
A 120-fold evidence asymmetry. Literature signal-to-noise ratio: MSM = 9,180 vs. PWID = 76. LOOCV validation: training set validated across 9+ trials (19,800 participants), held-out set from Bangkok 2013 (2,413 participants). The evidence base itself is structurally biased.
Slide 21 — Conclusions
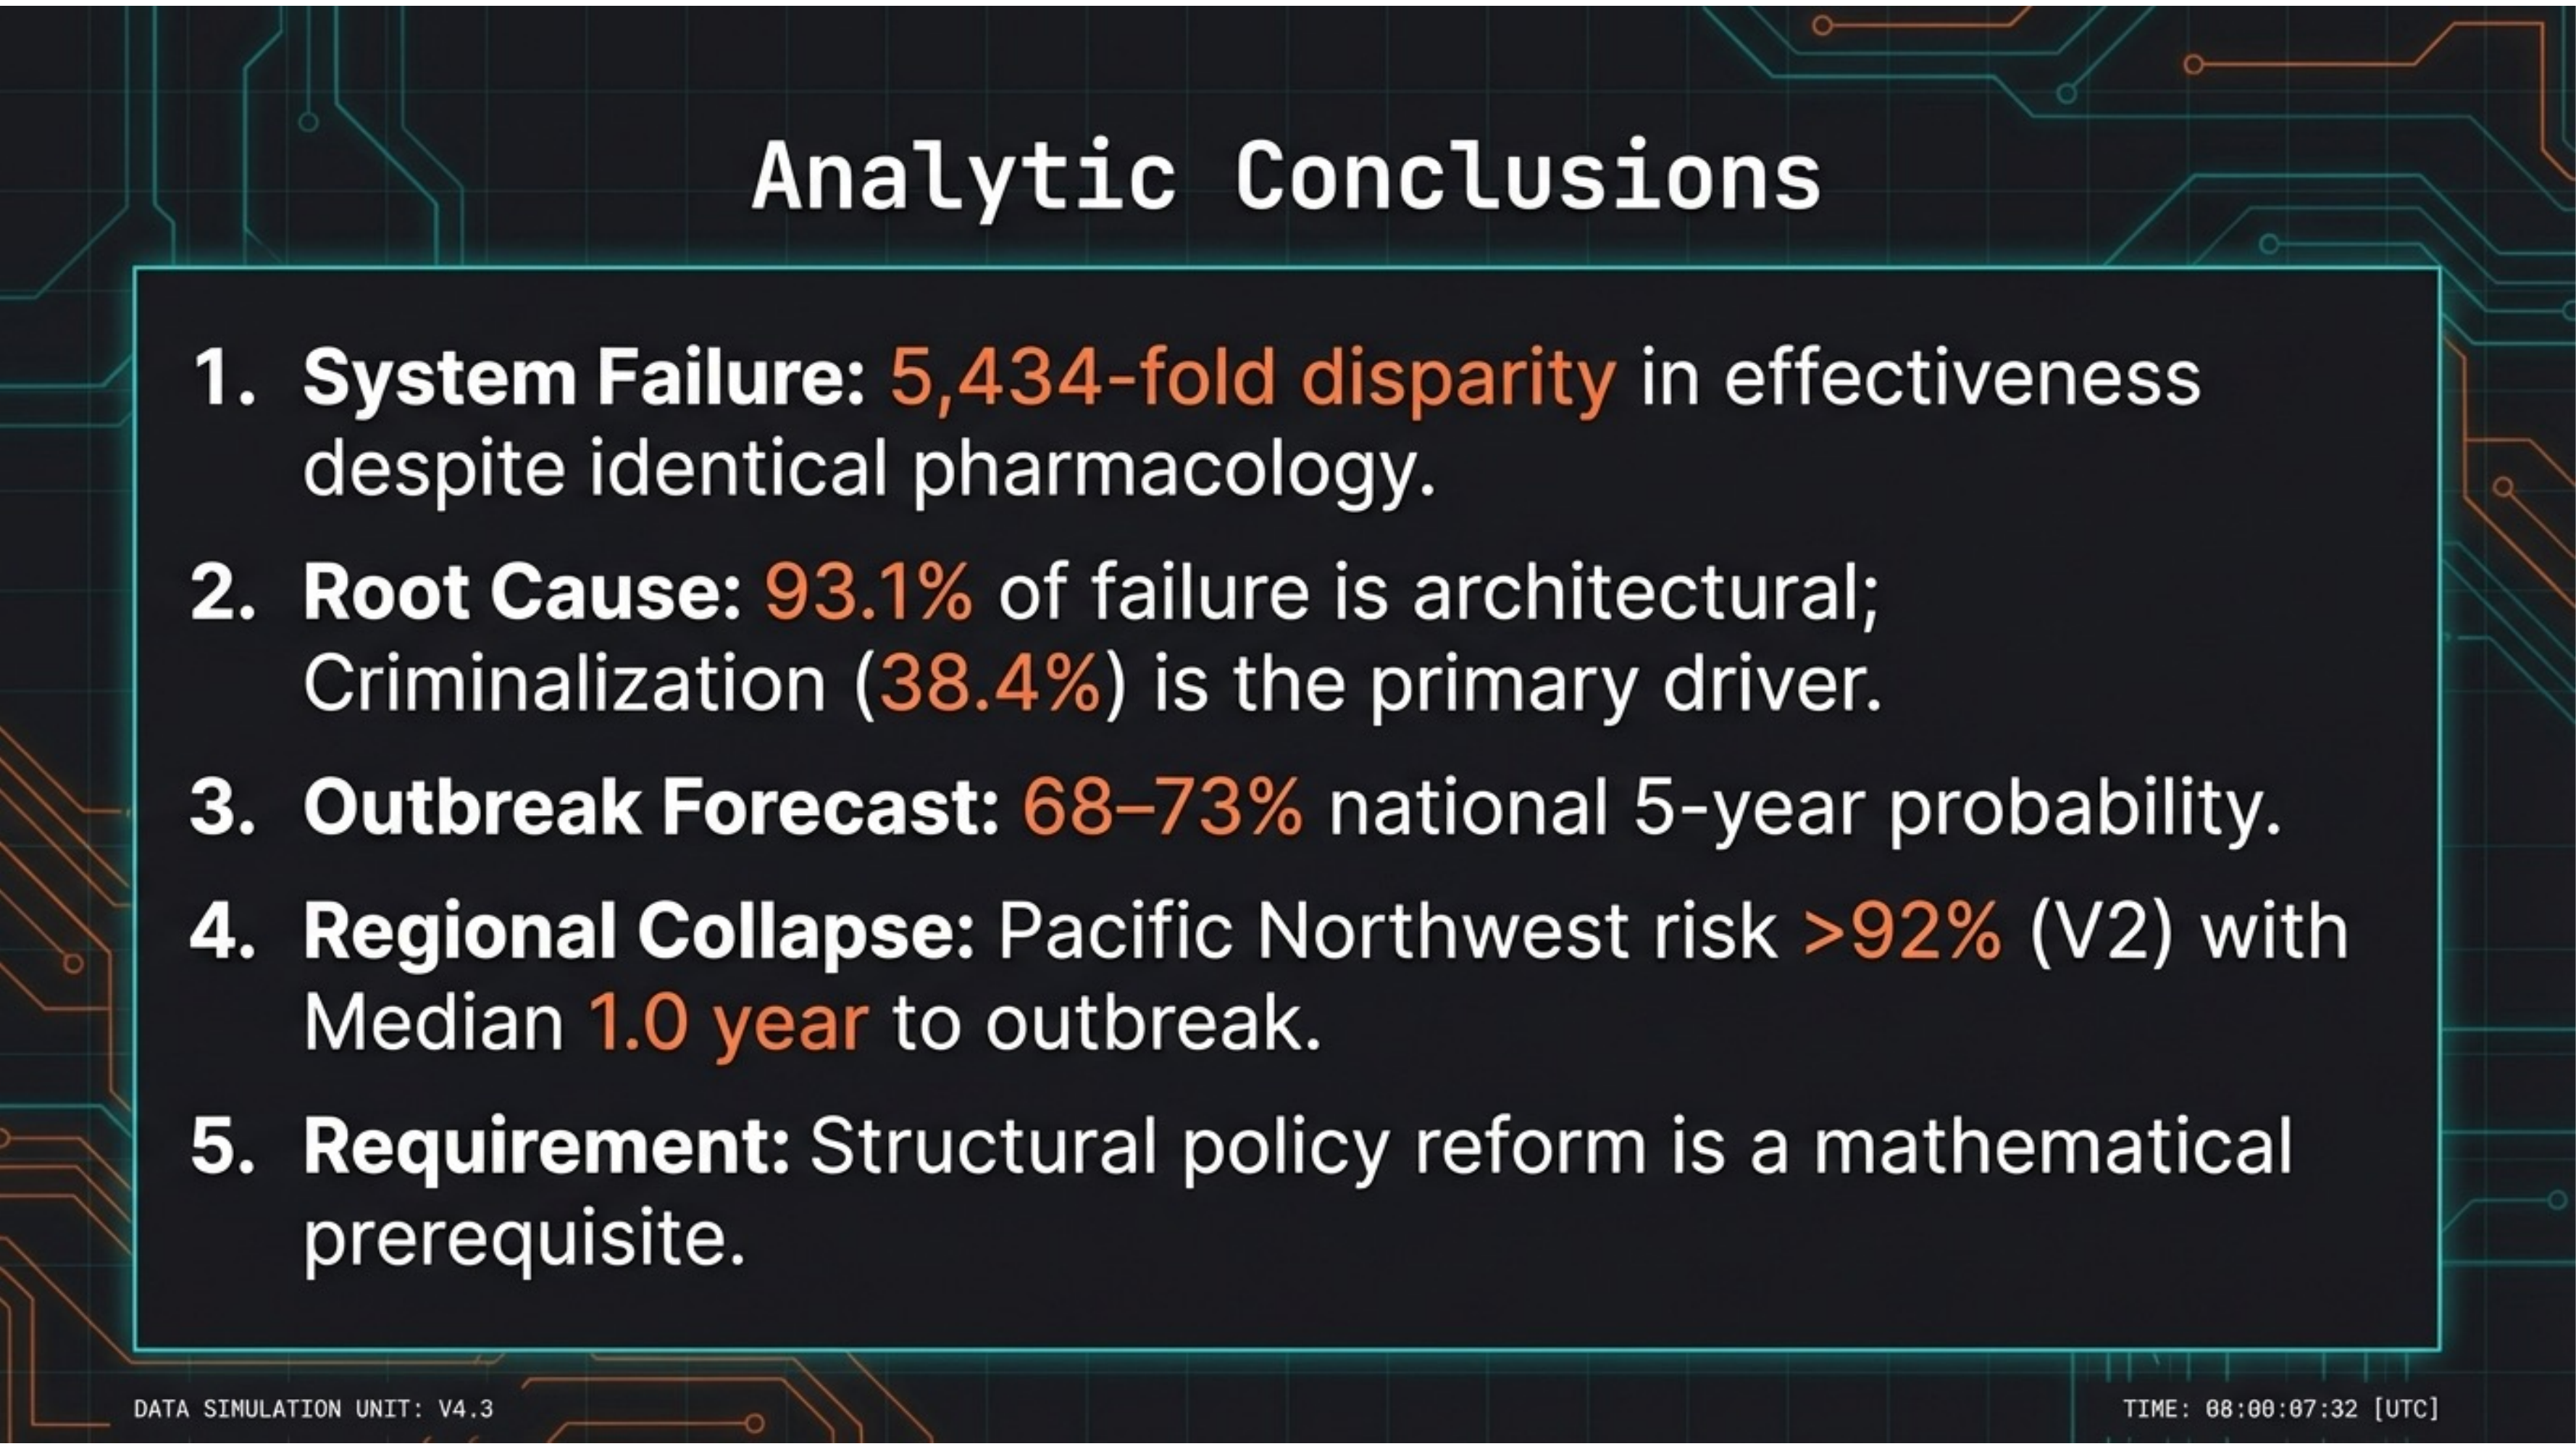
Five conclusions. 1. System failure: 5,434-fold disparity despite identical pharmacology. 2. Root cause: 93.1% architectural, criminalization at 38.4%. 3. Outbreak forecast: 68–73% national 5-year probability. 4. Regional collapse: Pacific Northwest >92%, median 1.0 year. 5. Structural policy reform is a mathematical prerequisite.